Dorling Map Generator
Input tags and values to produce a Dorling Map (i.e. bubbles). Output is an svg.
Instructions
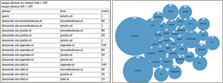
To create a Dorling map: 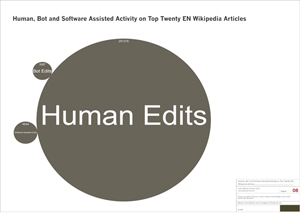 Example: Wikipedia Bots project. This dorling map shows the shares of human edits, bot edits and tools-assisted human edits in the top twenty English language Wikipedia articles.
If you want a double Dorling map (i.e. opening two Dorling maps side by side):
Example: Wikipedia Bots project. This dorling map shows the shares of human edits, bot edits and tools-assisted human edits in the top twenty English language Wikipedia articles.
If you want a double Dorling map (i.e. opening two Dorling maps side by side): 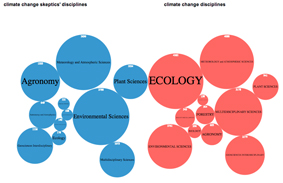 Example: Climate Change Skeptics project. Comparing Climate change science disciplines to climate change skeptics' disciplines.
- Login with your Issue Crawler username.
- Input tags (or phrases) and their values to produce a Dorling Map (i.e. bubble graphs).
- The output is an svg file.
Example: Wikipedia Bots project. This dorling map shows the shares of human edits, bot edits and tools-assisted human edits in the top twenty English language Wikipedia articles.
If you want a double Dorling map (i.e. opening two Dorling maps side by side): - create the two Dorling maps
- write down the ID of the Dorling map you want on the right-hand side.
- Open the map you want on the left-hand side
- Add &map2=## to the url, where ## is the ID number, and press enter.
- The output is an svg file.
Example: Climate Change Skeptics project. Comparing Climate change science disciplines to climate change skeptics' disciplines.Sample project
A bubble graph is a powerful visualization tool, and could be an alternative to a tag cloud.
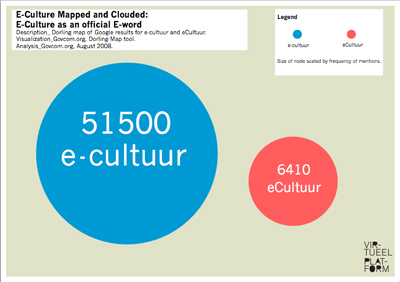
In the sample project E-Culture Mapped and Clouded, the Dorling tool was used to map the Google search results for the query e-cultuur, as well as for the query eCultuur. The results indicate that e-culture is now a recognized 'e-word', according to Google results.


| I | Attachment | Action | Size | Date | Who |
Comment |
|---|---|---|---|---|---|---|
| |
dorling.png | manage | 9 K | 12 Dec 2008 - 10:47 | AnneHelmond | Tool icon |
Ideas, requests, problems regarding Foswiki? Send feedback