Visual analysis and controversies
Team Members
Leader: Tamara Metze
Team: Andrea Benedetti, Elaine Rabello, Gabriel Valerio (participants), Efrat Gommeh, Peter Grond (guests)
Special thanks to organizers of the DMI summer school 2018!Contents
Summary of Key Findings
Briefly describe your most significant findings.1. Introduction
Injections with nano-compounds that ‘manipulate’ our pears, flames from the drinking water tap due to hydraulic fracturing, a whole new weapon-arsenal based on synthetic biology, are but three examples of influential images of contested technologies. Engaged citizens, experts, politicians, industry and others defend, develop or despise technologies in passionate ways. They frame facts and uncertainties in accordance with their values and beliefs.These visual framing aspects of policy controversies should be better included in analysis of the emergence and dynamics of these controversies. The visualisations create an extra dimension, as (1) they may introduce imaginaries and ‘alternative facts’, (2) they travel with high speed across the internet and on social media, and (3) they transcend administrative and geographical boundaries ((Clancy and Clancy 2016; Grabe et al 2009; Metze in press; Wozniak et al 2016).
In this research project, we aimed to map the framing contests – both in words and in visuals – in an emerging shale gas controversy in three countries / internet regions: Mexico, the United Kingdom, South Africa.
2. Research Questions
The main research question:
What are competing frames and competing visuals in emerging controversy over shale gas in the United Kingdom, South Africa and Mexico?
-
What actors and coalitions in these three countries are involved in the shale gas controversy?
-
How do the actors frame shale gas: what issue words do they use?
-
What are the opposing actors, what are (their) opposing frames?
-
What visuals and clusters of visuals are present in the three countries?
-
What are competing/contrasting visualizations?
-
What are differences and similarities in the visualisations between countries and the actors in those countries identified as pro, against and neutral?
-
What are differences and similarities in the visualisations between pro-fracturing; contra-fracturing and neutral actors across the thre countries?
3. Methodology
3.1. Research design
We selected three countries in which shale gas reservoirs are relatively high, and contestation is different:
-
Mexico: 545 trillion cubic feet estimated recoverable resources (United States Energy Information Administration 2013) Technically Recoverable Shale Oil and Shale Gas Resources: An Assessment of 137 Shale Formations in 41 Countries Outside the United States". Analysis and projections.. 13 June 2013.)
-
South Africa 390 trillion cubic feet estimated recoverable resources (United States Energy Information Administration June 2013).
-
UK 822 TCF to 2281 TCF, with a central estimate of 1,329 trillion cubic feet 9British geological Survey)
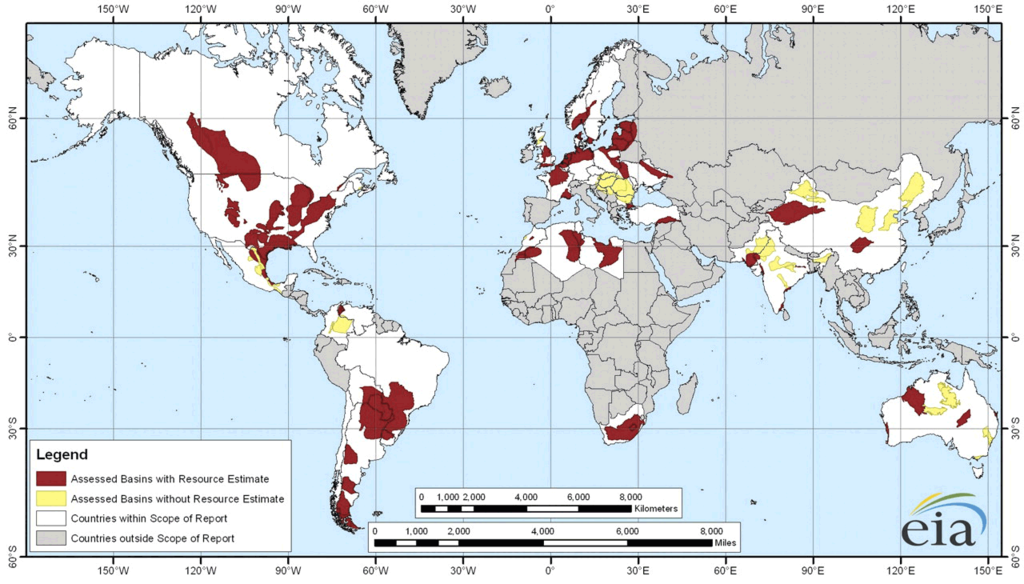
Figure 1: Map of estimation of recoverable resources, US Energy Information Administration data, 2011
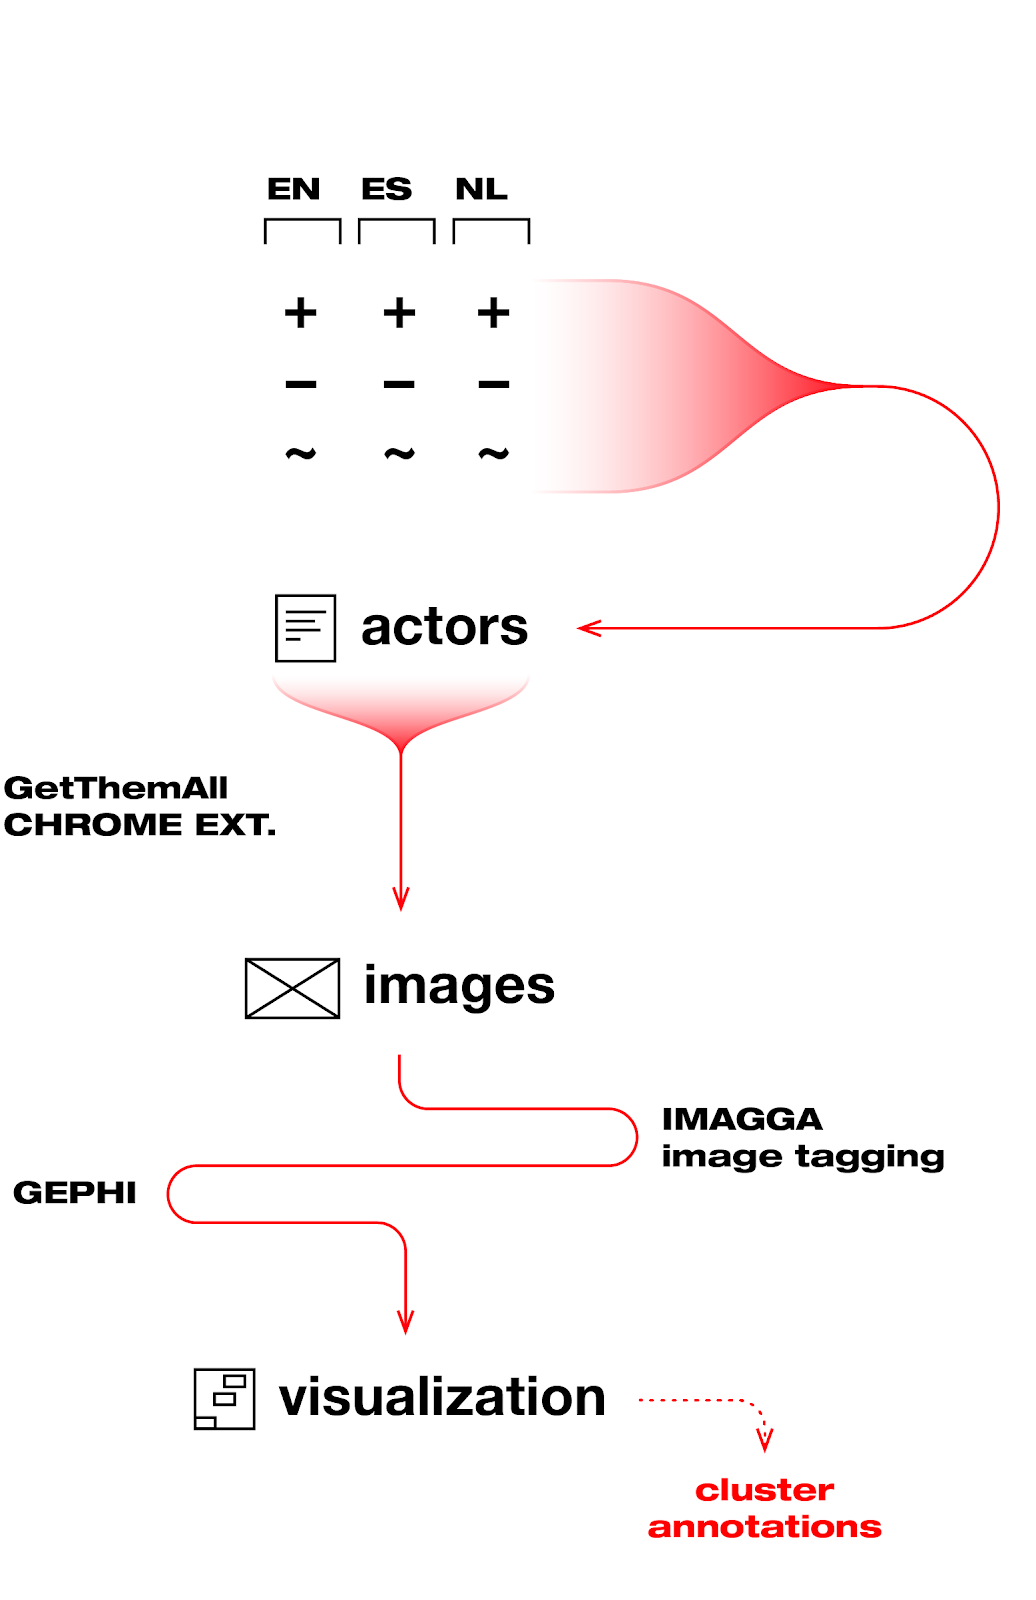
3.2. Data gathering
Creating of two data sets: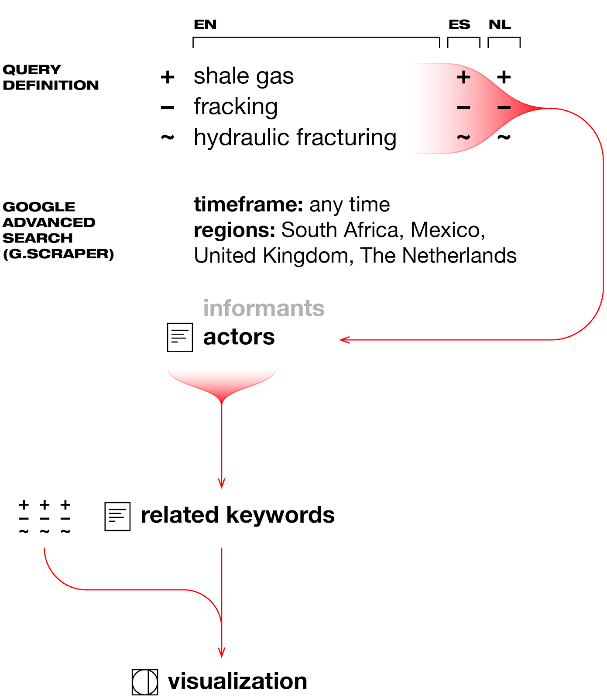
3.3 Data analysis
- issue networks across countries between pro, against and ‘neutral’ actors
- issue networks within country: tag clouds
- visual clusters
- visual clusters in combination with actors pro and against – per country
- Visual clusters in combination with actors pro and against across countries (industry, government (is now people in Andrea’s figure); ... ,
4. Visualizations and Findings
4.1. Actors pro, contra and neutral in each country
-
Mexico relatively more PRO - because they are government trying to implement; resistance in alliance across Latin America. Less local.
-
UK: there is a big controversy - arguments against: some of the scottish government who have banned it. Not one clear issue
-
South Africa: mixed - and more on water use.

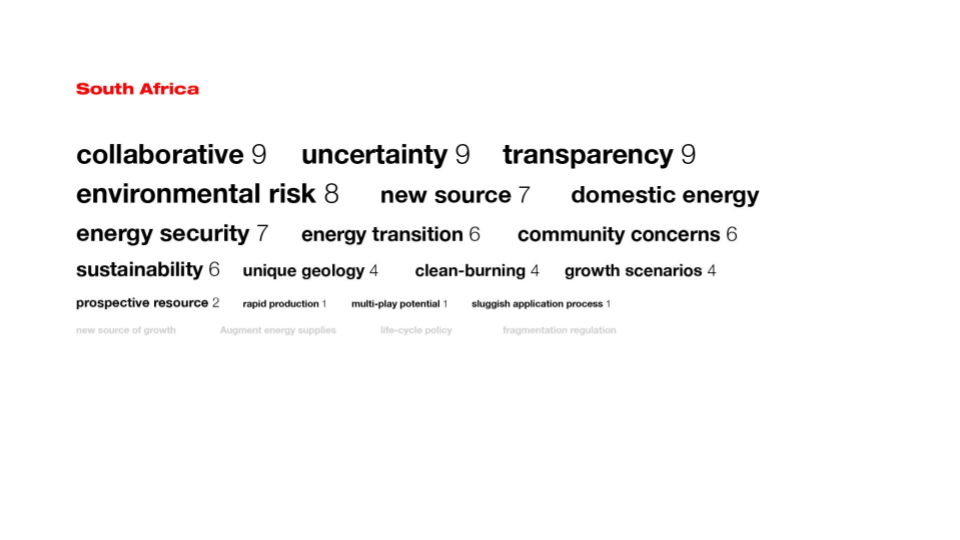
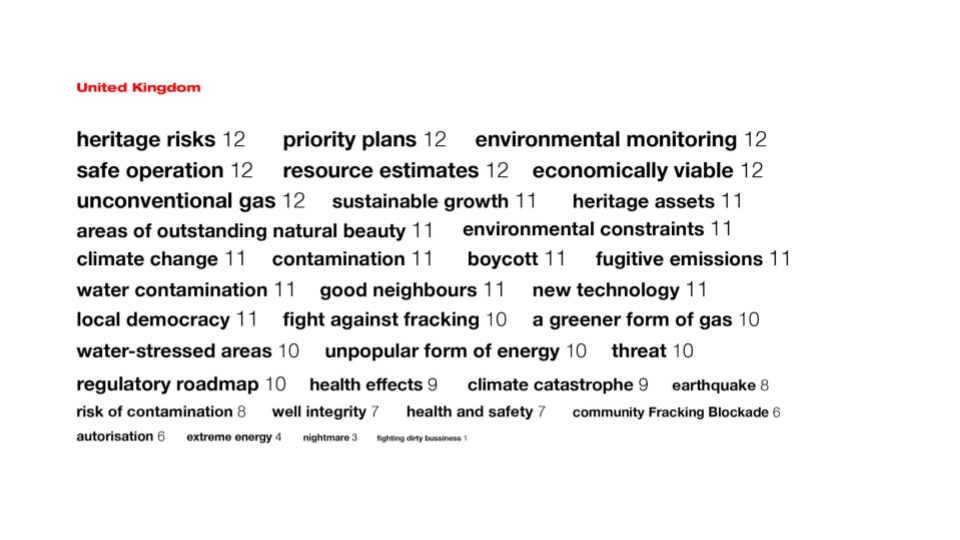
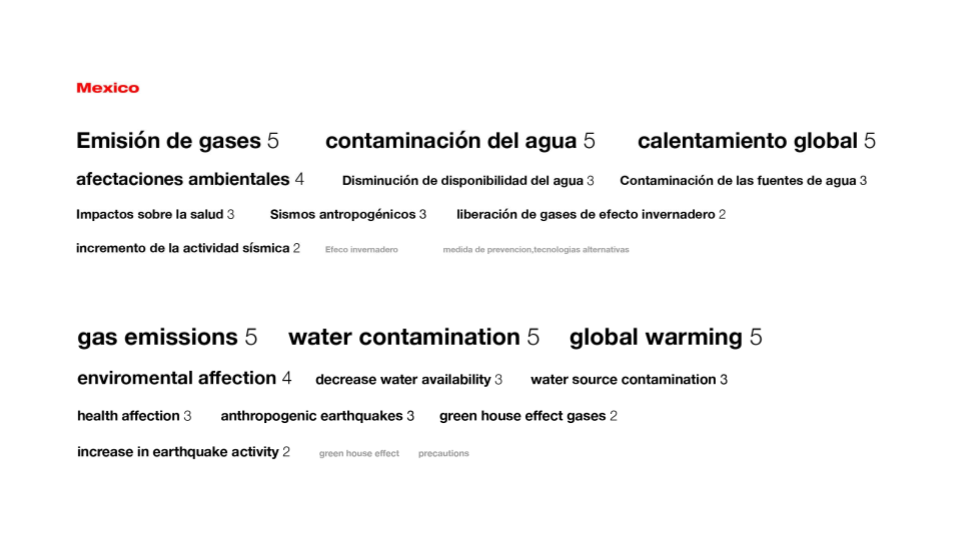
4.2. Issue clouds per country
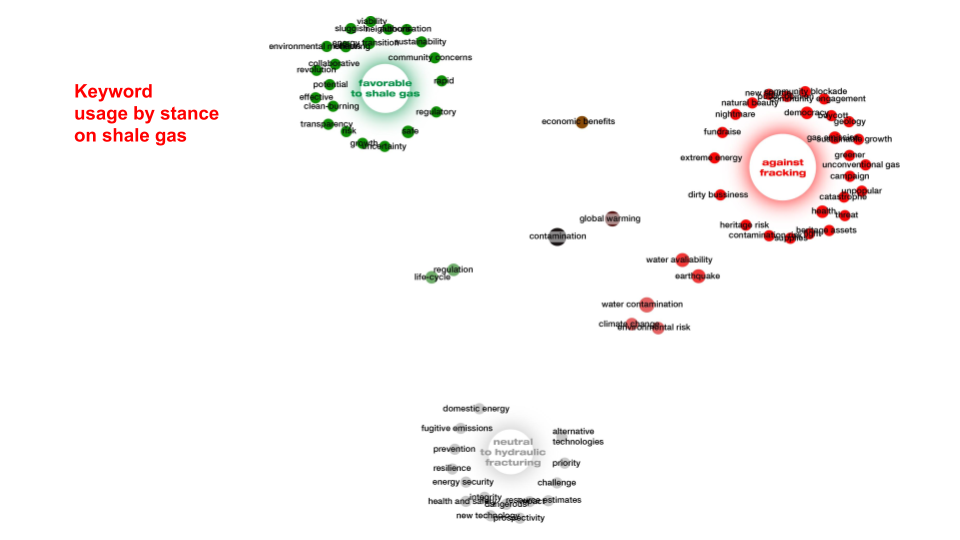
4.3. Word clouds across countries between pro, contra and neutral
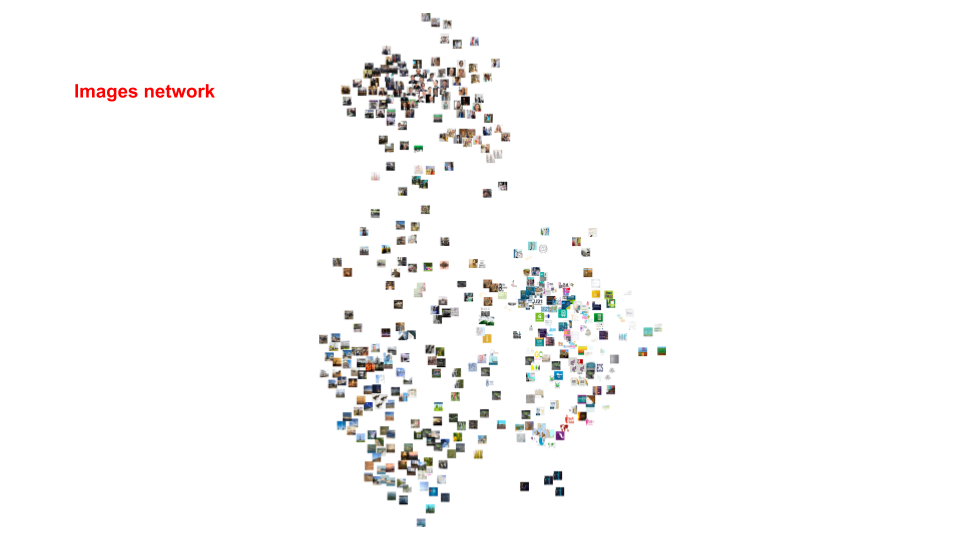
4.4. Image networks
4.5. Images, actors per country
5. Discussion
The results of the textual analysis show differences in the use of issue words
-
Between countries
-
South Africa: procedural language
-
UK: technical language (both pro and con)
-
Mexico: climate change but in combination with economic benefits (government/business speak)
-
2. Across countries, between actors
-
-
Anti coalition across the countries uses wors such as: 'dirty', 'disaster' - and more more emotion words, such as fear and anger)
-
Pro-coalition across countries use more positive words: Sustainable, growth, opportunity - words that are inviting to start exploring and extraction of shale gas.
-
Neutral coalitions uses more procedure words - 'let’s talk' and inviting to debate)
-
Hence: Controversies on internet also have local color- but actors across the world do share a language system
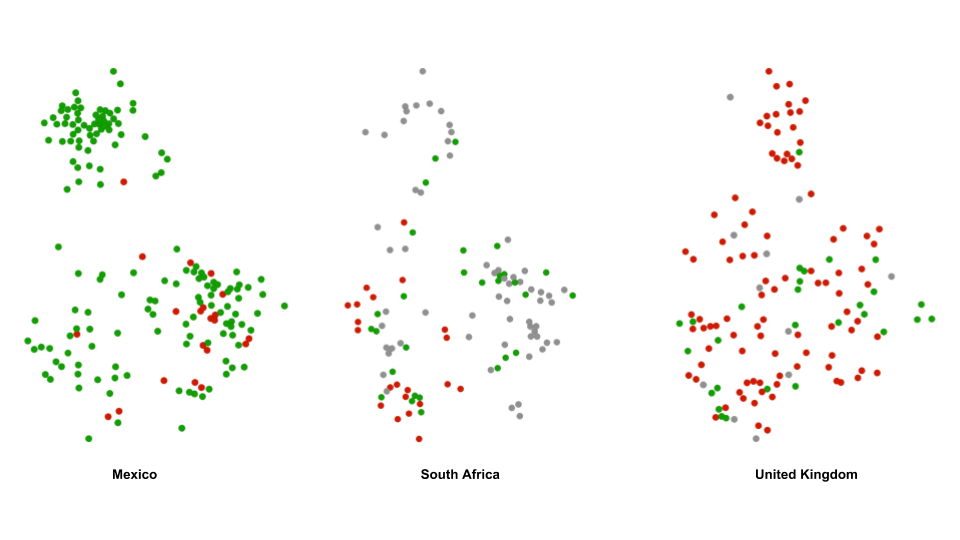
The results of the visual analysis
-
South Africa:
-
Many neutral actors, these use most of all visuals of expert people (photo's) and some graphics
-
There are some pro and con actors that use different landscape images: this indicates that most of all the impact of shale gas on the landscape is contested
-
-
UK: all sorts of actors use all sorts of visualisations. There is a lot of controversy (red and green dots)
-
Mexico: mainly green actors that are pro shale gas (most of all governmental actors) and they use many governmental people in their images (photos)
-
Three emblematic images that we conducted a revearsed image search for: these three images were used by actors in mixed ways - and most of all tracved back on image banks.
6. Conclusions
Criticalities in the studies:
-
Limitations in use of digital tools:
-
Different actors important on internet in the controversy (only through informants) -in comparison to a actor analysis based on newspaper articles and policy documents.
-
Difficult to integrate textual and visual analysis
-
Interpretive (qualified) and digital (quantified): use of digital methods comes hand in hand with interpretive methods.
-
Future studies
-
Analysis of visuals in combination with actors (stances)
-
Improve the complementarity of interpretive methods and digital methods
-
Actors query: differences in dominance on internet; dominance in decision-making
-
Keyword query: manual/extraction/manual - how to do it critical - not the pizza/beer technical teenagers from sillicon valley ;)
-
Visuals: sorting based on other categories/
-
-
How to produce critical tags, labels, web entities in automated searches.
7. References
Clancy&Clancy 2016 Growing monstrous organisms: the construction of anti-GMO visual rhetoric through digital media, Critical Studies in Media Communication, Volume 33, 2016 - Issue 3
Grabe, Maria Elizabeth & Erik Page Bucy (2009) Image Bite Politics: News and the Visual Framing of Elections, New York: Oxford University Press.
Metze, T. (in press) “Visual framing for policy learning: internet as the eye of the public”, In N.F. Dotti (ed): Knowledge, Policymaking and Learning for European Cities and Regions, Series: New Horizons in regional science, Edwar Elgar.Wozniak, Antal, Hartmut Wessler & Julia Lück (2016): Who Prevails in the Visual Framing Contest About the United Nations Climate Change Conferences?, Journalism Studies Coverage and framing of climate change adaptation in the media: A review of influential North American newspapers during 1993–2013 James D. Ford, Diana King, Environmental Science and Policy 48 (2015) 137-146
Ideas, requests, problems regarding Foswiki? Send feedback