A critical genealogy of the Getty Images Lean In Collection:
Researching the feminist politics of stock photography across representation, circulation and recontextualizationTeam Members
Giorgia Aiello, Atossa Atabaki, Federica Bardelli, Erik Borra, Jorinde Bosma, Aliki Eleftheriadou, Alixia Garceau, Elias Gorter, Denise van Kollenburg, Katharina Lueke, Donato Ricci, Lotte van Rosmalen, Giovanna Salazar, Alexander Sommers, Charlot Verlouw, Anne ZwaanContents
Introduction
In early 2014, the biggest leading stock image databank in terms of global market share, Getty Images, launched a new photo collection called Lean In. They started the collection “to shift perceptions, overturn clichés, and incorporate authentic images of women into media and advertising” (LeanIn.org). The Lean In Collection was created in collaboration with Facebook’s COO, Sheryl Sandberg, and the Lean In Foundation. Following some of the key principles of Sandberg’s neoliberal feminist manifesto and bestselling book, the collection’s aim was to represent women as both empowered and authentic. The compilation of pictures curates stock photographs as “devoted to the powerful depiction of women, girls and families” (LeanIn.org). The Lean In Collection currently includes 7,833 images.
The image banks like Getty Images that sell ready-to-use ‘stock’ photographs online have become the visual backbone of advertising, branding, publishing, and journalism. Also, daily exposure to stock images has increased exponentially with the rise of social networking and the generic visuals used in lifestyle articles and ‘clickbait’ posts. The stock imagery business has become a global industry through recent developments in e-commerce, copyright and social media.
The company American Getty Images produces photos for three different markets: creative professionals, the media and corporations. They present themselves as being environmentally aware and upholding strong ethical standards. In 2013, the most searched keywords in the Getty Images database of over 80 million images were ‘women’, ‘business’ and ‘family’.
Although people see these images almost everyday, stock images are most often overlooked rather than looked at. Thus, why should these images be ascribed any power since people do not particularly pay attention to them? Following Paul Frosh’s work on stock photography from the early 2000s, the research project argues that stock images are not only the ‘wallpaper’ of consumer culture. They are also central to the ambient image environment that defines our visual world, which is now increasingly digital and global. Pre-produced images are the raw material for the world’s visual media. In other words, stock photographs are essential to how people engage with media content online - across genres, platforms, and borders.
The popularity of stock images and the aims of the Lean In collection make the Lean in collection interesting to investigate.Initial Data Sets
The initial data set consisted of a collection of stock photos taken from the Lean In Collection on the Getty Images website. The Lean In Collection pictures generally illustrate women, men and children, which portray empowered women in various settings. The collection was based upon the Lean In movement which originated from the Lean In: Women, Work, and the Will to Lead book. The Lean In.org supports women in 3 important ways including through community, education and circles (Lean In About).
The Lean In Collection currently holds 7,833 pictures which were scraped in order to collect metadata like tags, photographers, hosts and categories. The first 6,000 images sorted by the default setting of Getty Images ‘best results’ were used as an input in the Google Reverse Image Scraper.
This resulted in 4,646 unique images with a total of 100,632 Google results. Out of the 100,632 Google results, the URL’s intertwined with the Getty Images website and the stock photo collections from Alamy and Masterfile websites were filtered out and resulted in a new total of 46,351 Google results. Additionally, images of chalkboards were removed as they return only false positives in Google Images.
For the purpose of this research project, two files were created. The first file contains the image counts per host and top 10 images with the most unique hosts on which an image appears. The image counts per hosts include the top 171 hosts with most unique images, which were then coded and categorized according to the various media outlets (social media, news websites, blogs, image bank, magazines, other). The second file refers to the top 10 images with the most unique hosts on which an image appears. For each of those URLs, the top 20 Google returns have also been coded and categorized according to the media formats and media topics (picture gallery, relationships, relationships & family, editorial, lifestyle, listicle, video, advertisement, science & technology, other).
Research Questions
Research Question 1: How do these images circulate? How do they exist and move across different online platforms and media outlets? Research Question 2: What do the images represent? In particular, how do they visualize women as both authentic and empowered? Research Question 3: How are these images recontextualized? How are they used across different media texts?Methodology
Step-by-step methodology plan:
-
All image URL’s of the Lean In Collection at Getty Images were scraped.
-
The first 6,000 images sorted by the default setting of Getty Images ‘best results’ were used as input in the Google Reverse Image Scraper.
-
This resulted in 4,646 images along with 100,632 Google results This results list was filtered by removing occurrences of the websites where the images were distributed (Getty Images, Alamy, Master Filter), leaving a sample of 46,351 Google results.
-
Meanwhile, a categorization scheme was created (three levels: media outlet, format, topic).
-
The 150 most frequently used photos are selected for the categorization.
-
Two groups are formed: one group looks at where the images appear, the other group codes for the topics that are covered.
-
The hosts file is coded by media outlet type: 5 separate coders, later trying to come to an agreement over the used categories. Up until at least the hosts hosting 20 or more images are coded. The top 10 images in the used images file are selected, for each image the top 20 URL’s where these images appeared are selected; this results in 200 URL’s, that are categorized by format and topic by 5 other coders.
-
During coding we discovered a glitch, where Google Reverse Image Scraper would link up images, to other images that looked similar. In this case we had some pictures with women in front of black chalkboards with white writing on it, which got linked to other pictures with people in front of chalkboards. So we deleted all the chalkboard-pictures from our dataset.
-
The results are analyzed and compared (quantitative).
-
Per category formed, some samples may be looked at in depth to create additional insights (qualitative).
-
Findings are used trying to answer whether the images are used mostly within the original Lean In purpose (empowering women) or not (traditional, non Lean In-related).
As already mentioned, this research looks at how stock photos get distributed and used in different contexts and places on the web. To see and analyze in which contexts the images from Getty’s Lean In Collection get used we used the Google Reverse Image Scraper. The Google Reverse Image Scraper was used to collect all the results of images.google.com for the Lean In Collection. Subsequently, we manually coded the results to categorize the data gathered from the Google Reverse Image Scraper.
Google Reverse Image Scraper
The team started collecting data on the Getty Images found in the Lean In Collection. With the Google Reverse Image Scraper tool, each group member follow the same steps towards the collection of data. On the Digital Methods Initiative website, the Google Reverse Image Scraper tool allows the group to retrieve results of ‘images.google.com’ via the Getty Images’ URL’s. The steps to retrieve these results went as followed:
-
Enter the URL’s of the Lean In Collection images.
-
Select the maximum number of results, which we set as “1000”.
-
Enter the local Google domain “en” for “English”.
-
Name the result file (e.g. “leanin_1501_2000”).
-
Click on “Scrape Google Images”.
Once the results analysis is launched, the tool categorizes and analyzes results and pop-up pages asking to fill out a ‘captcha’ are likely to appear. Out of the initial data sets of 7,833 images, 6,000 Lean In Collection images were analyzed. These results were then manually deeper analyzed.
Categories
For the categorization, we decided to do three different categorization-schemes: Media Outlets, Media Format and Topics. These three schemes were chosen because each of them looks at the context of the pictures from a different angle:
| Media Outlets | Media Format | Topics |
| News websites | Listicle | Work & Career |
| Magazines | Editorial | Lifestyle & Health |
| Social Media | News | Relationships & Family whenever the topic is related to parenting |
| Blogs | Advertisement | Science & Technology |
| Image bank | Other | Other |
| Other |
These categories were chosen based on our initial reading of the raw data, gathered from the Google Reverse Image Scraper. We chose five/six broad categories per category-scheme, which was done so that every item could be categorized as neutrally as possible.
Formats and Topics:
Part of the group coded and categorized the top 20 websites for each of the top 10 most used pictures, not including the Getty URL’s website, and analyzed their results. The focus of this section of the research involved both category-schemes, media formats and media topics. Out of 194 websites, the final results illustrated an even distribution amongst the various media formats, while a more radical distribution of the media topics occurred. The media formats results emphasized two categories: “listicle” and “other”, followed closely by “editorial”. The “listicles” mainly depicted lists of media topics like “Lifestyle & Health” and “Work & Career”. The “other” also consisted of a majority of “Lifestyle & Health” and “Work & Career”. Nonetheless, three out of seven “Science&Technology” topics were present in the “other” media formats.
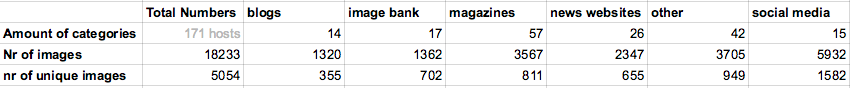
Images per Host
Based on the images per host (without the Chalkboard and Getty Images) a total of 171 hosts were analyzed, which all had more than 30 images. These were categorized by the media outlets blogs, social media, news websites, magazines, image bank and other:
Kimono Tool
The KimonoLabs website is organized in a way to help visualize data. As for this project, the data collected through the previous tools were analyzed to provide illustrations, which support our findings.
Findings
During the 2016 Digital Methods Initiative Winter School, the multidisciplinary team conducted research concerning the feminist politics of stock photography across representation, circulation and recontextualization. The first step consisted of analyzing the top ten most frequently used pictures from the Lean in Collection. Thereafter, the team categorized the images according to three different categorization-schemes: the Media Outlets, Media Format and Topics. This section gives an overview of the different findings.Research Question 1 - How do these images circulate? How do they exist and move across different online platforms and media outlets?
The Getty images originating from the Lean in Collection are circulating on the Internet as Getty Images sells the ready-to-use stock photographs online. The photograph’s rights are either managed or royalty free (figure 1). For most media outlets, over 50% of the photos are right-managed. The photos within the image-bank itself are mostly royalty-free.As seen on image 2, the photographs flow from the image bank to different sources such as: blogs, news websites, social media etc. The amount of use on social media platforms is significantly higher, compared to other media outlets. Another significant finding, image 3, is that the number of pictures scraped by the Google Reverse Image Scraper, is not equal to the unique number of unique images. For example, the amount of images traced back by the image scraper for the website superstock.com gives a total of 103 images. Nevertheless, the amount of unique images is merely 30. This indicates that most pictures are used several times. Another factor is the number of authors who have their pictures incorporated into the Lean in Collection (figure 4) Significant is that most pictures are linked to two authors: Thomas Barwick and Hero Images. In addition, the most used keywords that refer to the photos within the Lean in Collection are people, adult, day, adults only and indoors.
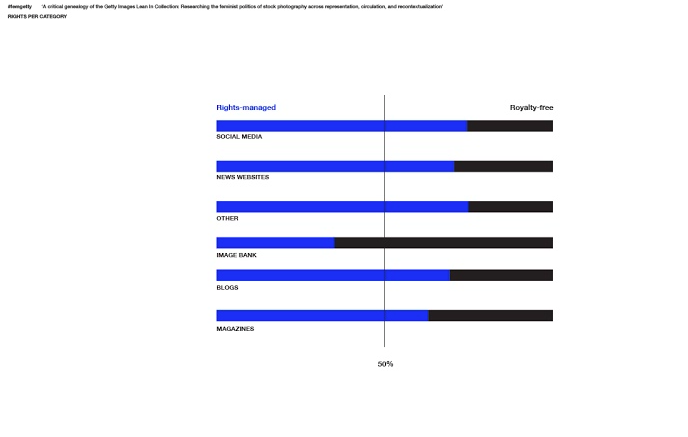 Figure 1: Rights-managed per media outlet
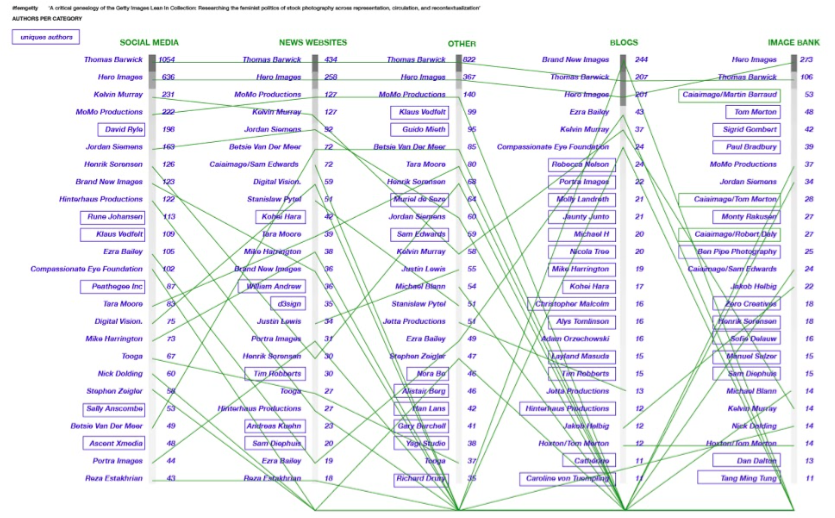 Figure 2: Circulation stock-photos
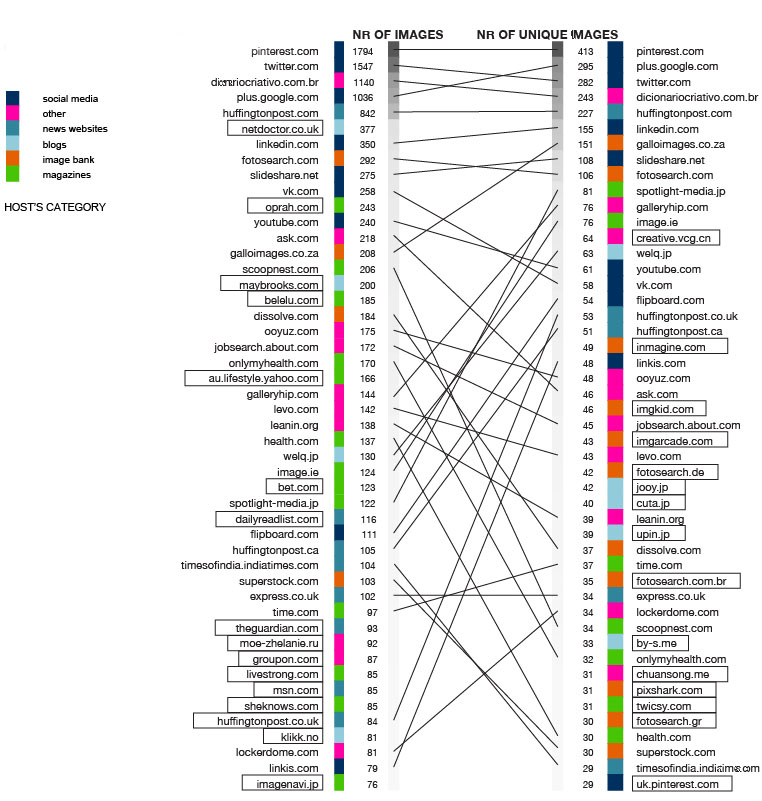 Figure 3: Host category: number of (unique) images per host
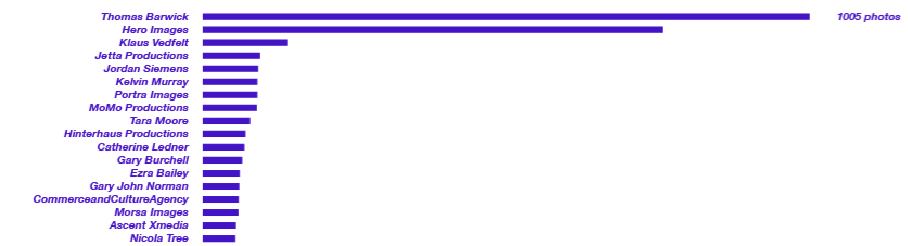 Figure 4: Photographers with the most photos in the collection
Research Question 2: What do the images represent? In particular, how do they visualize women as both authentic and empowered?
Titles
Figure 4: Photographers with the most photos in the collection
Research Question 2: What do the images represent? In particular, how do they visualize women as both authentic and empowered?
Titles
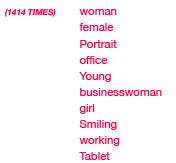 Image 1: Top 10 most used words in the titles of the photos.
For the entire Lean In collection at Getty Images, the titles given to the photos were analyzed. Image 1 shows the top 10 most frequently used words within these titles. This shows that words related to the female gender (woman, female, girl, businesswoman) and work related (office, businesswoman, working) are the most frequent. Also, the words “young”, “smiling” and “portrait” stand out. These results indicate that a typical photo found within the collection may depict a portrait of a young, smiling woman at work.
Image 1: Top 10 most used words in the titles of the photos.
For the entire Lean In collection at Getty Images, the titles given to the photos were analyzed. Image 1 shows the top 10 most frequently used words within these titles. This shows that words related to the female gender (woman, female, girl, businesswoman) and work related (office, businesswoman, working) are the most frequent. Also, the words “young”, “smiling” and “portrait” stand out. These results indicate that a typical photo found within the collection may depict a portrait of a young, smiling woman at work.
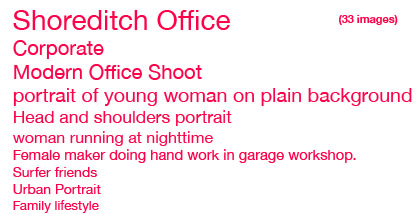
Image 2: Top 10 most used full titles for the photos.
Image 2 shows the top 10 most used full titles found within the Lean In collection at Getty Images. Interestingly “Shoreditch Office” is the most popular title found. Shoreditch is a trendy neighborhood in London, representing a positive and successful entrepreneurial vibe. The top 3 used titles are all business related, showing an emphasis on promoting women in the labor market.
Tags
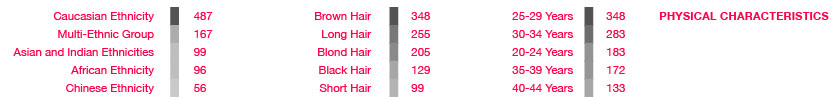

Image 4: Top 5 most frequent conceptual, descriptive and technical tags.
In image 4, the frequence of all non-physical related tags are shown, ordered by concept, descriptive and technical types. Regarding the concepts (where “concepts” are more concrete than “conceptuals”) an emphasis on being together can be seen (togetherness, connection, bonding, cooperation). This is interesting, as this concept is not concretely a part of the Lean In ideology. Happiness and business related concepts are also clearly represented. Descriptively, adult people are dominant. Since people (women) are the focus of the Lean In ideology, this is unsurprising. Daytime pictures seem to be prefered, this may promote a more active ideology. Many photos have been tagged as indoors, possibly because of the amount of work related photos. For the technical part, it appears that the tags have not been added consistently, since the amount of the tags “photography” and “color image” are not representative of the total amount of color photos found in the collection. The “waist up” and “front view” tags are interesting, as most images are apparently made from a close range and showing the face of the person photographed, indicating that there is an emphasis on the person rather than the action or environment.
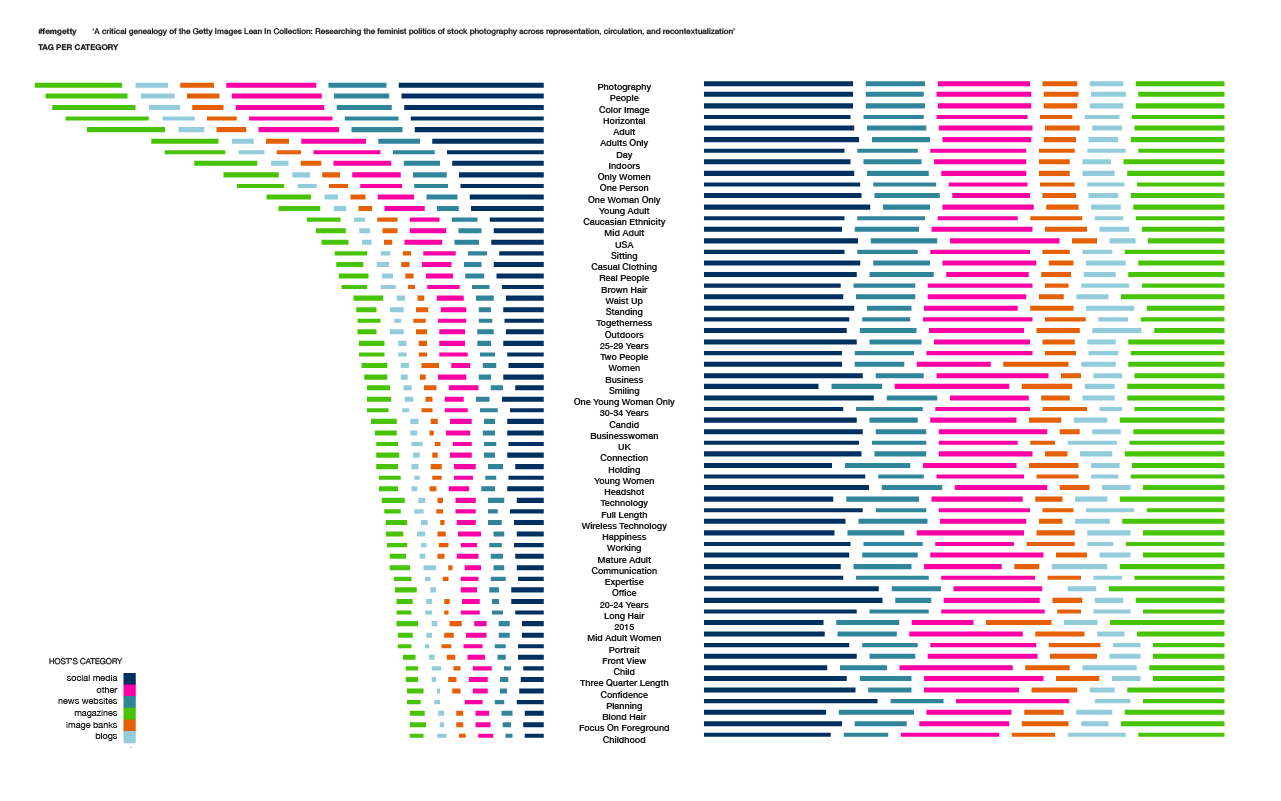
All tags combined (both physical and other descriptions) are ranked by frequency in image 5. The colors indicate on what type of media host the images that used the specific tag where found. The left side shows the absolute amounts, the right side shows the relative amounts. Some findings that result from this are that tags related to young people are more popular on social media (20-24 years, one young woman only), while interestingly the “smiling” tag is not very highly represented in social media. In news media, “technology” and “expertise” are some of the more used tags, while the “20-24” is less prevalent. In the “other” category tags are relatively balanced, “smiling” is one of the higher ranking tags while “woman” is one of the lower ranked. On image banks “caucasian ethnicity” and “women” are more popular than “business” or “ businesswomen”. Interestingly, the “child” and”childhood” categories are relatively popular on blogs. Finally, for magazines there seems to be a focus on “indoors” “office” related photos.
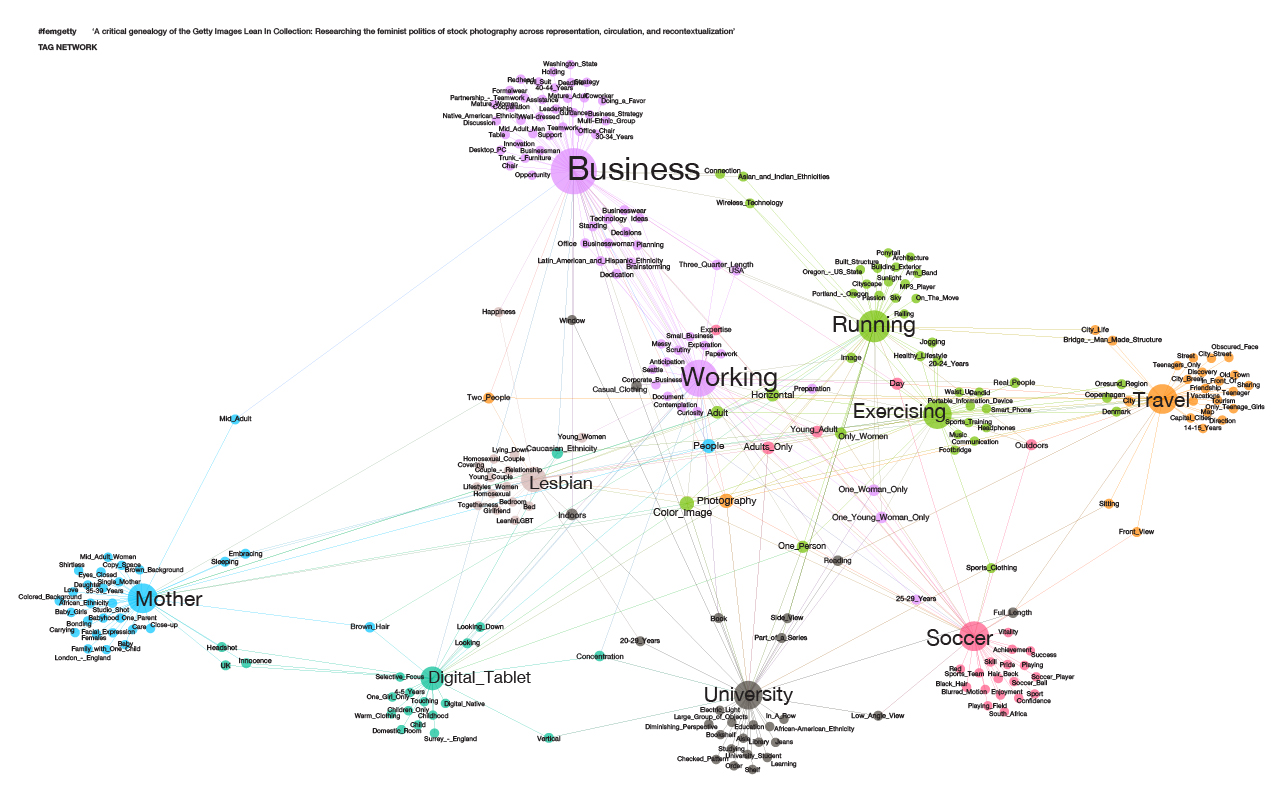
Image 6: Tag network graph for top 10 most used photos.
In the tag network in image 6, the tags used for the top 10 most used images are connected in a network graph. The size of the node indicates the amount of connections. This shows that business and working are the most frequently used tags for the top 10 photos. The nodes in the middle are the tags that are most shared between different clusters of topics. The most connected of these are “working” and “lesbian”. It is interesting that “lesbian” is one of these, since only one of the top 10 photos depicts a lesbian couple.
Research Question 3: How are these images recontextualized? How are they used across different media texts?
Getty provides keywords to all their images. Users can choose keywords to find the perfect picture to match their topic. Since the keywords are linked to the images by Getty, they capture the context Getty places the images in. For most images, this contextualisation is in sync with the way the image is used on the outside website. Images that carry keywords like “business” and “office” were most often placed in the “work” category by the coders; “embracing” and “homosexual couple” were used for texts on “relationships”. All photographs fit into their categories at least partly: however, sometimes the keywords would hint at categories that were not represented by the coded categorization. This points towards a contextualisation intended by Getty that was not adopted by the outside world.
One example of this is the category “Science and Technology”. Four of the ten most popular photos feature technology like smartphones and tablets, either showing women running with smartphones or women in a business setting using tablets. The keywords (e.g. “innovation” or “wireless technology”) would also designate these photos for tech journalism. However, only two were used in a text that the coders put under “Science and Technology” - and then only sparingly (four out of twenty texts and one out of twenty texts).
Another finding is that photos portraying a black woman are generally used to actually discuss race and ethnicity. They are used mostly on websites that are focused on black communities, immigrants or muslims. In business settings, however, the photographs generally do feature women with non-western ethnic backgrounds.
Limitations
During this research, a few limitations were encountered regarding the retrievement of the data. Firstly, the Google Reverse Image Scraper crashed several times during the scraping process of 500 URL’s. This resulted in creating batches of 100 URL’s a time to scrape successfully. Another complication was the fact that the server went down during the process, which disabled the scraper from analyzing. The data gathering took more time than expected, but eventually we managed to gather all the data.
The Lean In Collection consists of 7,833 pictures which we were not able to analyze totally. Eventually we scraped 6000 images, which resulted in 4,646 analyzed images. Google only allows the Image Reverse Scraper to scrape 10 results per page, which is probably why it took a long time. Also a lot of captchas appeared during this time, interrupting the scraping. Continuous WiFi was a must for the batch of URL’s to complete because when stopped Google Reverse Image Scraper would crash and stop scraping. Also Google recognized different chalkboard related pictures as to be the picture from Getty Images. This resulted in multiple errors, as the pictures did not resemble.
While most of the images featured on gettyimages.com were excluded from the image results, other image banks like Alamy and Masterfile clouded the findings. In the host websites that we had to code manually, many were other stock image websites and therefore not relevant for our results.
The coding of the hosts and images had to be done manually. This was very time consuming and sometimes it was difficult to agree on categories and keywords. What is the exact difference between a blog site and an online magazine? What is the difference between a listicle and editorial genre? These were hard questions to answer. Furthermore some photos appeared in a catalogue of articles. In the categorization of the stock photos it was difficult to define them as part of article or part of catalogue. And because the coders could see each other work and code the sites, it was easy to influence each other's choices.
Another error in the results from Google Reverse Image Scraper was that some Getty Images were not found when opening the link to the host websites. So while the coders were working on naming the content and media outlets, the picture would in some cases not appear on the host website. This raises questions about the accuracy of the tools used.
The data research is a good tool to analyze the contextualization of the images but the actual work is only possible manually. To really define the use of stock images on their new host websites, the data results should be analyzed for a longer period of time.
The data visualizations are very interesting, but might prove to be difficult to understand for people who weren’t part of the research team.Conclusions
The Lean In Collection was created “to shift perceptions, overturn clichés, and incorporate authentic images of women into media and advertising” (LeanIn.org). This research focused on three research questions related to this intention: how do the images circulate, what do the images represent and how are the images recontextualised? The images are found most often on social media platforms. Regarding women’s representation in the Lean In Collection, the patterns that are most likely to be found are images of women who are 24-29 years old, Caucasian and have brown hair. For every one African woman, five Caucasian women are represented in the collection. These numbers illustrate the results regarding Caucasian women as the primary ethnicity within the Lean In Collection pictures. The context of the photos could be determined by looking at the keywords provided by Getty Images. While most of the images were used in the context they were intended for, it was noticeable that tech journalism does not yet use many images from the Lean In Collection: even women using technology are most often used in other categories. Most stock images are used for content on lifestyle (e.g. fashion, food, sports and health). These are not the topics Lean In intended the images for.Bibliography
Aiello, Giorgia. “A critical genealogy of the Getty Images Lean In Collection: Researching the feminist politics of stock photography across representation, circulation, and recontextualization” in Project Description. Digital Methods Winter School 2016. 11-15 January 2016.
Den Tex, E. (2016). Google Reverse Image Scraper [Web]. en, Amsterdam, NL: Digital Methods Initiative. Retrieved from https://tools.digitalmethods.net/beta/googleReverseImages/
Getty Images. 2014. Lean In Collection. 15 January 2016. <http://www.gettyimages.co.uk/collections/leanin>
Kimono Labs. 2015. 11 January 2016. < https://www.kimonolabs.com >
Lean In. “About Lean In” 15 January 2016. < http://leanin.org/about/ >

| I | Attachment | Action | Size | Date | Who | Comment |
|---|---|---|---|---|---|---|
| |
FemGetty_final_presentation.pdf | manage | 1 MB | 15 Jan 2016 - 14:13 | GiovannaSal | Final presentation of the project #femGetty |
Ideas, requests, problems regarding Foswiki? Send feedback