Mapping deepfakes with digital methods and visual analytics
Team Members
Discourse mapping: Craig Ryder, Greta Timaite, Luca Hammer, Maria Luiza (Malu) Paschoal, Olga Bialy, Kun Zhang, Yanling Zhao, Yiran Zhao, Tong Wu.
Image vernaculars and trends: André Rodarte, Andrea Elena Febres Medina, Antonella Autuori, Golnar Gishnizjani, Hannes Cools, Junyi Chen, Shilan Huang, Xiaolu JI.
Computer vision: Yelyzaveta (Lisa) Glybchenko, Mengyuan Sun, Yucong Lao, Flavia Saxler, Megan Leal Causton, Jieyi Ke, Gaia Amadori, Rosa Arroyo, Paulina Sierra, Sara Nuta, Arwyn Workman-Youmans, Giulia Tucci, Lorenzo Giuseppe Zaffaroni, Tatiana Smirnova, Yingwen Wang, Henrique da Costa, Martin Roth, Kola Heyward-Rotimi, Francisco Kerche. Facilitators: Richard Rogers, Lucia Bainotti, Sarah Burkhardt, Gabriele Colombo, Janna Joceli Omena, Jason Chao.Contents
- Team Members
- Contents
- Summary of Key Findings
- 1. Introduction
- 2. Research Questions
- 3. Initial Data Sets
- 4. Methodology
- 5. Findings
- 6. Discussion and conclusions
- 7. References
Summary of Key Findings
-
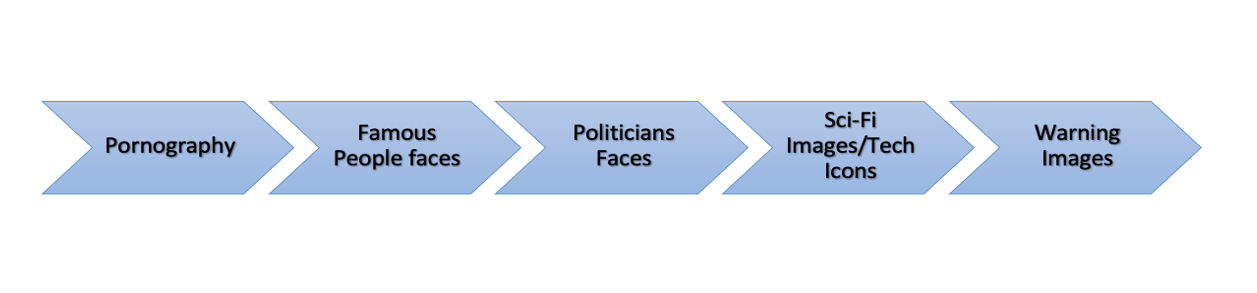
Clear evolution of discourses over time (both visual and textual):
Porn and deepfake pornography
→ Fake news, information disorder (Twitter) and moral panic
→ Tech solutionism, detection & regulation
→ Commercial content, deepfakes as a lucrative industry, the future of deepfakes. -
Explicit content has disappeared from our network from 2018 onwards; however, provocative content has been integrated into the mainstream.
-
A ‘technification’ and ‘anti-technification’ of certain concepts (such as security becoming more personal in the discourse - related to identity; but face becoming more technified).
-
Emerging infrastructure specific to deepfake that has changed since 2017 with new industries emerging around that. Platform businesses such as Amazon seem to have an increasing impact here, others such as Pinterest lose impact.
-
From the web entities analysis, deepfake appears to have different vernaculars for different geographical locations → methodological implications of using web entities vs visualising Google images with ImageSorter.
1. Introduction
Looking at the history of visual media technology, with each new innovative technology there often came along a “widespread perception that a ‘pictorial turn’ is taking place, often with the prediction of disastrous consequences for culture.” (Mitchell and Hansen, 2010, p.37) Whilst consequences have not been proven to be disastrous in every case, these innovations had indeed a fundamental impact on society as they were deeply intertwined with the broader political, economic and cultural context. Nowadays, in our digital era, machine learning technology can be argued to be the most innovative and revolutionary field within computer science – coming with new societal or cultural fears and concerns. While the wide attention towards machine learning within computer science has turned into an own project to ‘demystify’ AI (Lorenz and Saslow, 2019; Campolo and Crawford 2020), this research project aligns specifically on the generative capacities of the technology (De Vries, 2019) that have caused the “prediction of disastrous consequences for culture” (Mitchell and Hansen, 2010, p.37) through changed conditions for image production. We will therefore look at the most known and ‘hyped’ type of AI generated content which depicts ‘authentic’ while creating ‘inauthentic’ content by design – deepfakes.Deepfakes are synthetic media that merge, combine, replace, and superimpose images and video clips to create fake videos that appear authentic (Westerlund, 2019). Even if practices of faking content do not represent a new phenomenon per se, the peculiarity of deepfakes lies in the use of deep learning, a sophisticated subfield of machine learning technology to manipulate audio and video content. These techniques, which usually necessitate large amount of compute and expertise, are becoming more and more accessible, thanks to the development of ad hoc, user-friendly apps for the creation of deceptive content (see, e.g. Sensity, 2019). Apart from this, there is a large variety of swallow fakes and cheap fakes, which use other more accessible technologies such as speeding, slowing, cutting, re-staging, or re-contextualizing footage (Paris & Donovan, 2019).
Therefore, deepfakes represent a particularly relevant issue to address, especially if considering that their production and diffusion by malicious actors could represent a serious challenge to the authenticity of online political discourse and the spread of disinformation (Chesney and Citron, 2019). The debate surrounding deepfakes has been mostly revolving around their use for fake pornography and image-based sexual abuse (Maddocks, 2020; Nagel, 2020). However, it is more and more important to question the implications of deepfakes for journalism, the diffusion of information, and the quality of democracy (Vaccari and Chadwick, 2020). Questions also arise about whether deepfakes and the like are indeed an actual threat for the circulation of disinformation and misinformation in the form of manipulated content, or they rather do not represent a “real problem” (Brandom, 2019). In other words, it is relevant to understand how deepfake technology is staged as a matter of concern. In this context, this project aims at understanding what are the main discourses surrounding the issue of deepfakes and how they evolve over time. This is functional to understand whether, and to what extent, deepfakes represent a threat for disinformation and misinformation, or whether it is more a matter of debunking the hype surrounding this issue. Moreover, our purpose is to map out the key actors, industries, and interests revolving around deepfakes, in order to understand how the potential dangers usually associated with these technologies intertwine with economic interests. While there is a whole technical field within machine learning that aims to detect deepfakes, we aim to study deepfakes in a sociological and cultural sense. In which contexts does it appear, and what does that say about our current (digital) culture, society, politics and economy? By means of networks of related issues, image grouping, and computer vision techniques, what can we learn about deepfakes from a birds eye view? How can we critically evaluate debunking efforts with the gained insight and knowledge? To reach these aims, the project is articulated in three subprojects:-
Discourse mapping;
-
Image vernaculars and trends;
-
Computer vision.
2. Research Questions
The project aims at answering to the following overarching research questions:
-
What are the discourses surrounding the issue of deepfakes?
-
How are these discourses evolving overtime?
-
What are the key actors, industries, softwares and interests surrounding deepfake technologies?
3. Initial Data Sets
The first step of the research consists of the creation of a dataset by collecting images from Twitter data and Google Image Search. In both cases, data were collected from January 2017 until June 2021. The collection of data from different sources represents the entry point to analyse deepfakes and to understand their main visual features and peculiarities.
Twitter was queried for the tweets containing either the hashtag #deepfake or #deepfakes, excluding RTs and replies.
Query: [#deepfake OR #deepfakes] -is:retweet -is:reply
Time frame: 01/01/2017 - 1/06/2021
95.831 tweets
19.713 unique photo URLs
Google Image Search
[deepfake]
Geolocation, country codes and timeframes:
NL (2017-2021) | BR (2019-2021) | UK (2021) | US (2021)
Total amount of images: 10.066
More information about the data collection and its limitations at this link.4. Methodology
Methodologically, the project makes use of digital methods to examine the online sphere that emerges around deepfakes and, more specifically, adopts various visual analytics for digital media research (Rogers, 2021), which allow us to address the exquisitely visual component of this kind of content. In the first part of the research, we map the issue of deepfakes and look at the different discourses surrounding it, by applying digital methods to the analysis of hashtags, text, URLs, and users (see Section 4.1.). Moreover, the use of metapictures (Rogers, 2012) is used as a way to highlight the visual patterns and discourses which characterize deepfake technologies, as well as to identify the dominant and marginal discourses (see Section 4.2.). Lastly, by means of computer vision techniques, we are able to delve deeper into the content of each image, analyse their circulation, and understand their geographical variations (see Section 4.3.). The combination of these three approaches allows for an understanding of deepfakes from different and complementary standpoints, as the results will show. Through the research, we maintained our interest in comparing how the discourses and representations around deepfakes change over time (from 2017 until 2021) and across platforms (Twitter and Google).
4.1. Discourse mapping
4.1.1. Hashtag analysis
To identify clusters of hashtags a dynamic network visualization was built. In the first step the dataset was converted into a GEXF file. Each Hashtag became a node. When two hashtags appeared in the same tweet, an edge between them was created. The timestamp of the tweet was added to the nodes and edges. The full script is published under the MIT license: https://gist.github.com/lucahammer/76ee21d93a428f83486bac03ac35aed9.
In the second step, the network was cleaned with Gephi. Because ‘deepfake’ and ‘deepfakes’ were used to collect the dataset, their nodes were removed in Gephi. This made the network slightly easier to read. To make the network easier to handle, Hashtags with less than 20 connections were removed.
Finally, the clusters were analyzed with Gephi. ForceAtlas2 with default settings was used to layout the network and Modularity classes (resolution 0.8) to color the different clusters. Each cluster was investigated individually by looking at the most connected hashtags and trying to understand what they had in common. If the theme of a cluster wasn’t clear, Twitter was searched for tweets that contained one of the data collection hashtags and one hashtag of the cluster until the theme became clear. With the help of the timeline slider the changes of the network over time were observed.
To make it easier to see changes over time, the modularity classes of the hashtags were exported from Gephi (nodes table) and matched to tweets and visualized with Python.
4.1.2. Text analysis
Text analysis, specifically word clouds, was used to understand the discourse surrounding deepfakes. For this, Twitter dataset (2017-2021) was used. Importantly, the dataset contained tweets in both English and non-English languages (such as Spanish), however for the analysis the dataset was cleaned so only tweets in English were left. This decision was made because none of the group members working on text analysis understood a language other than English present in the dataset. Also, English was the dominant language in which tweets were written. Finally, the dataset was split into 8 half-year periods in order to detect shifts in the discourse.
Word clouds were computed in two ways. Unigrams (word clouds made up of single words) were made using Tag Cloud Generator software developed by the DMI. Bigrams (word clouds made up of two-word phrases) were generated using R programming language. The decision to use Tag Cloud Generator and R for word cloud generation was motivated by a couple of reasons. First, unigrams can reveal the most frequent words, however they might be picked up out of the context (e.g. “Mexico”, does it refer to Mexico as a country or Mexico City?). Bigrams help to address this methodological shortcoming of unigrams. Thus, both methods were used to complement each other and improve the understanding of what is happening in the tweets. Second, there was an underlying curiosity to explore a clean/dirty approach to research. For instance, how does the generator, which has its own unique affordances, shape the output of data? It seems that the generator automatically excludes various stop words (such as pronouns, compound forms, etc.) while in R it has to be done manually. Besides the stop words, the following ones were also excluded when using R: "https", "t.co", "deepfake", "deepfakes". The first two are segments of the URL embedded in the tweet while the last two are the keywords used to query Twitter API and, thus, were deemed excessive as it was known that the tweets are about deepfakes. Essentially, relying on a software to generate findings might be faster and easier, yet it is done so by sacrificing the ability to control, and potentially the understanding of, the process of word cloud generation.4.1.3. URL analysis
The URL analysis was conducted in a way combining quantitative and qualitative approaches. Among the initial dataset of 95000 tweets, we filtered more than 37000 tweets containing URLs and excluded all links of Twitter photos, leaving 15000 URLs left. The URLs were then divided by year since 2017. We selected top 20 URLs for each year (except for 2017, when there were only 4 links) according to their occurrence and manually extracted related host names, forming a new dataset of 84 URLs.
The annual top URLs were manually coded into categories according to their contents, based on communal agreement of two group members. There were in total 13 categories, with the category “news” containing 15 subcategories. The results of categorization were then reflected in the Sankey diagram to show the overtime changes.
We also used bump chart to show the continuity and discontinuity of hosts across years. Finally, top 3 URLs per year were selected for further qualitative analysis based on close reading towards the media content.
4.1.4. User analysis
We have used a quanti-quali approach to digital methods. Firstly, we have selected our cases using a quantitative approach by doing some summary statistics. For a second step we have carried out a content analysis within the most active and a discourse analysis on the most influential profiles and their tweets. For the most influential accounts, we have first divided the dataset by year (2017, 2018, 2019, 2020, 2021). As a proxy to ‘influence’ we have considered the number of retweets. Then, we have picked the top ten most retweeted by each year, totaling fifty tweets, and 33 unique accounts.
The aim was to understand how the most influential profiles within the deepfakes debate took part in the collective narratives surrounding it, throughout the years, and who are the main actors. The main points assessed were the profile accounts (account description, profile picture, user name, profile URL) and the tweet (text, hashtags, shared links, and shared images).
After selecting our sample, we have analyzed all of the fifty accounts and categorized them regarding the following analytical categories:
-
Regarding the profile (images and texts):
-
Type of account: the kind of actor we were looking at, e.g., if it was a government account or a media account.
-
-
Regarding the tweets (images and texts):
-
The central theme in the text and image of the tweet, e.g., if it was talking about fake news or content creation;
-
Attitudes towards deepfakes, the actor's framing on the deepfakes matter;
-
Sentiment towards the issues of deepfakes (if it was negative, neutral, or positive).
-
We have also conducted a content analysis on the most active users, meaning the users who tweeted the most in the time frame considered, and their respective tweets. Here, 4.615 tweets were analysed, from the top 10 most active accounts. Within this analytical group we have also accessed the profiles image and textual data using the same points and within a qualitative method. However while analysing the tweets other categories and a content analysis were carried. The analytical categories used for the second part mentioned were:
-
Regarding the tweets (images and texts)
-
Kind of repetition on the content.
-
Perceived goal on the communication goal.
| 1.1. Account Type | Governmental; Political; Creative; Porn; Tech Press; Tech Company; Academic; Entertainment business; Tech Company; Mainstream Media; Digital Marketing Company; Non-profit; Tech Solutionist; Tech Organization and/or Advocator; Others. |
| 2.1. Central Themes | Fake news; Politics; Personal and National Security; Technological Developments (AI, ML, etc); Personal Security; Academic; Porn related; Entertainment; Comedy, Political Parody. |
| 2.2. Attitudes | Dystopian; Warning; Impressed; Tech Progress; Informative; Self-promotion; Publicity; Creative |
| 2.3. Sentiment | Positive; Neutral; Negative |
| 3.1. Kind of content repetition | Spammy; Retweets; Repetition on believable content sharing. |
| 3.2. Communication goal | Self-promoting; Trend emptying; Informative; Political Campaign |
Table 1: Analytical categories on users analysis.
4.2. Image vernaculars and trends
4.2.1. Top image analysis (Twitter)
-
The top images analysis contributes to our understanding of the visual representations surrounding the issue of deepfakes, but it also says something about the Twitter profiles engaged in these discussions.
-
To analyze the top images regarding deepfake on Twitter. We first cleaned the dataset of all Tweets with images retrieved from 4-CAT. Next, using the pivot table, we identified which images appeared the most each year from 2017 to 2021. We also analyzed the most retweeted and the most replied to images over time.
-
Furthermore, we accessed the URLs of original tweets to look closer at the differences between images that occurred most and were mostly engaged with.
4.2.2. Visual attributes analysis with ImageSorter
1. To have a rich insight into visual platform vernaculars, we plot images according to color using ImageSorter. It enables rapid quick visual comparison of a great number of images and highlights patterns in the data. Thus, we illustrate the database with several plots of images from Google Image and Twitter.
2. In the first step, we upload the images of each year for different geolocational Google settings separately in ImageSorter. Following that, we take screenshots from the plot of each year. Thus, it provides an overview from each year that depicts each platform's dominant and marginal color clusters over time and in different geographical locations. Organizing images in this way helps us not only to identify homogeneously color clusters but also to spot images that have been posted frequently in each color cluster. In addition, it enables us to depict timeline trends in different geographical locations over time.
3. Afterward, we zoom in to each year's dominant and marginal color cluster to recognize the central theme of the images in each cluster. In addition, to analyze images within-platform, the identification of images type and theme gives this opportunity to look at the data by comparing two different platforms, Twitter and Google, in a preliminary attempt at developing a cross-platform analysis. Furthermore, sorting images facilitate cross-cultural comparison between dominant and marginal images that have been published in different contexts.
4. Overall, we consider that qualitative comparisons of color/sorted image plots over time and/or between platforms can demonstrate evidence of the changes and transactions around deepfake images which underpin online meaning/making and social interaction (O'Neill & Smith, 2014).
4.2.3. Thematic cluster analysis with Pixplot
By using PixPlot, we firstly performed a thematic image grouping of Google Images over time. Pixplot, unlike Imagesorter which is only able to recognise colour similarities between a set of images, allowed us to plot all the images in a three-dimensional space according to their visual similarity, taking into account not only the colour aspect but also the shapes and type of content (text, person in the foreground, nature, politicians) contained in them.
1. We plotted all images in the Google Images Search 2017-2021 database with temporal metadata using Pixplot, and obtained a network of images divided by visual similarity and temporality. For the final visualisation, we created a GIF in Photoshop showing how the visual thematic clusters related to deepfake have been populated over time.
2. For the vernacular analysis we created 10 grids of images (one for each year per platform) with Pixplot, organised within them by visual similarity. We then arranged them within a timeline layout that allowed us to have a direct comparison both between years within the same platform and between platforms in the same years. In order to annotate the main visual clusters, we created a visualisation on Figma that involved the creation of boxes of different colours to highlight the clusters of images representing a given visual theme.
4.3. Computer vision
To make sense of the deepfakes images, suggested by Google Image Search overtime (2017-2021), and the Twitter images responsive to #deepfake or #deepfakes, we used a computer vision network approach by taking advantage of the potentialities of Google Vision API for research purposes (Omena, Pilipets, Gobbo, & Chao, forthcoming). The image dataset was first inserted in Memespector GUI (Chao, 2021) to invoke Google Vision API, opting for one feature: web entities and pages detection. Next, with the output files, we built computer vision networks using Google vision feature for the analysis of Google images and Twitter images with their geolocation, as described below.
-
Networks of image description (with Google images).
Image-web entities networks: image description from web content using Google Vision’s ‘web entities’. Connections mean the occurrence of web-entities in relation to images (sections 4.3.1 and 5.3.1). The visual ego networks analysis were guided by key web entities related to themes such as technology, pornography and culture. -
Networks of image circulation (with Google images).
Image-domain networks: referring to the webpages where fully matched images are found (sections 4.3.2 and 5.3.2). -
Networks of computer vision feature and platform grammars (with Twitter images geolocation).
Image location-web entities networks: referring to the study of image collections in relation to geolocation. (sections 4.3.3 and 5.3.3)
These networks have two types of nodes (bipartite graphs): one being the image, whereas the other stands for the Google Vision chosen feature or the image geolocation provided by Twitter API. In the next sections, we provide more detailed methodological guidance for each analytical task.
4.3.1. Web entities analysis (Google images overtime)
For web entities, Google Vision data was used to create bipartite networks of terms that have been used to categorize images related to the core term ‘deepfakes’. These networks were visualized in Gephi and included two types of nodes: terms for the web entities and the images that they are tied to. After creating these network visualizations with appropriate coloring and labels for the nodes, our work started from defining three key themes that emerged in the network: technology, pornography and culture. These themes were decided on using the conceptual overlaps between different web entities. Within each theme, we selected several key web entities for further in-depth analysis:
-
technology: “deep learning”, “face”, “security”.
-
pornography: “deepfake pornography”, “x videos”.
-
culture: “art”, “celebrity”, “politics”.
We mapped and analyzed ego networks of key web entities in the network across the years 2017-2021. The ego networks were used to make observations on how web entities’ dynamics changed over time with the images.
4.3.2. Image circulation (Google images overtime)
We analysed how images related to deepfakes circulate on the web. Google Images data and Google Vision’s ‘fully matching images’ feature were used. For all images, this feature returns all websites' URLs where an image can be found. We created a bipartite network of circulation based on the co-presence of an image in more than one website. Once all the networks were presented we proceeded using both a quantitative and a qualitative approach. On one hand, we visualized bipartite networks (2017-2020) using images and their relation to websites where they could be found. This enabled us to understand the patterns of image circulation occurring in various clusters across different networks. To get more in depth, we also plotted the ego network considering the neighbours of neighbours of the most relevant actors. In a more quantitative approach, we created a plot of change in eigenvector centrality (the centrality of a node weighted by the relevance of its neighbors) (Alvarez-Socorro et. al. 2015). The reason for adopting this metric is twofold: firstly because it is not sensitive to extreme measures, secondly because it privileges the relationship between central actors (therefore a site that has many images but is not well connected tends to not have a strong result in comparison to those that are better connected). This way we were able to identify the main actors across a period of time.4.3.3. Geographical mapping (Twitter data & web entities)
We have employed a combination of visual analysis techniques to analyze a set of images with country code data retrieved from the Twitter API. Our strategy was to consider the images’ country information as a fixed variable and then explore the combination of
-
user hashtags posted on Twitter,
-
Google Vision API web entities results,
-
and the image files sorting and visual analysis,
considering the geographic perspective.
Plotting the world map of deepfakes conversation on Twitter:
In order to identify where #deepfake or #deepfakes related images circulate geographically on Twitter overtime, we used the geolocational information in the dataset in two ways:
(i) Geocoordinate plot: we enriched the image data with coordinate data based on the address given in the “user_location” field, querying OpenStreetMap Nominatim.
(ii) Choropleth map and animation: we used the country-code geolocation information in the dataset to calculate and plot the density of tweets per country on a world map for each year where data exists. In this approach, each image in the dataset is counted as 1, without further qualification. The choropleth coloring corresponds to the density of the aggregate number of images for each given country-code in the dataset. In order to show the temporal development, we created an animated GIF based on the visualizations.
Visual Network Analysis:
Aiming to identify the existence of country-specific discourses around deepfake and the themes comprising these country-specific discourses, we conducted three different network analyses according to the same procedure:
-
Twitter hashtags - images network;
-
Google Vision API web entities - countries network;
-
Google Vision web entities - Twitter hashtags network.
5. Findings
5.1. Discourse mapping
5.1.1. Dominant themes around deepfakes
Our research presented that hashtags used with #deepfake and #deepfakes can be grouped into 6 main clusters: Technology and Security, Conspiracy, Porn and Media and Entertainment. However, apart from the 6 main clusters, it is possible to find a few smaller clusters. Most clusters extended their size in 2019. The only exception was the cluster related to conspiracy theories and politics as this group of hashtags decreased in 2019, and was growing in the first half of 2020. The most popular hashtag that was used with #deepfakes, #deepfake was the #ai hashtag.
Based on the co-hashtag analysis we can see that the discourse surrounding deepfakes changes over time. While some clusters of hashtags have not changed much (for example the information cluster), others extend their size significantly or their related subtopic changes. Interestingly, not every group of hashtags changed in the same way. The biggest cluster is the one related to technology. However, the cluster with the biggest number of nodes is the one related to movies and entertainment. Security discourse started earlier than other discourses and is highly interconnected to technology discourse.
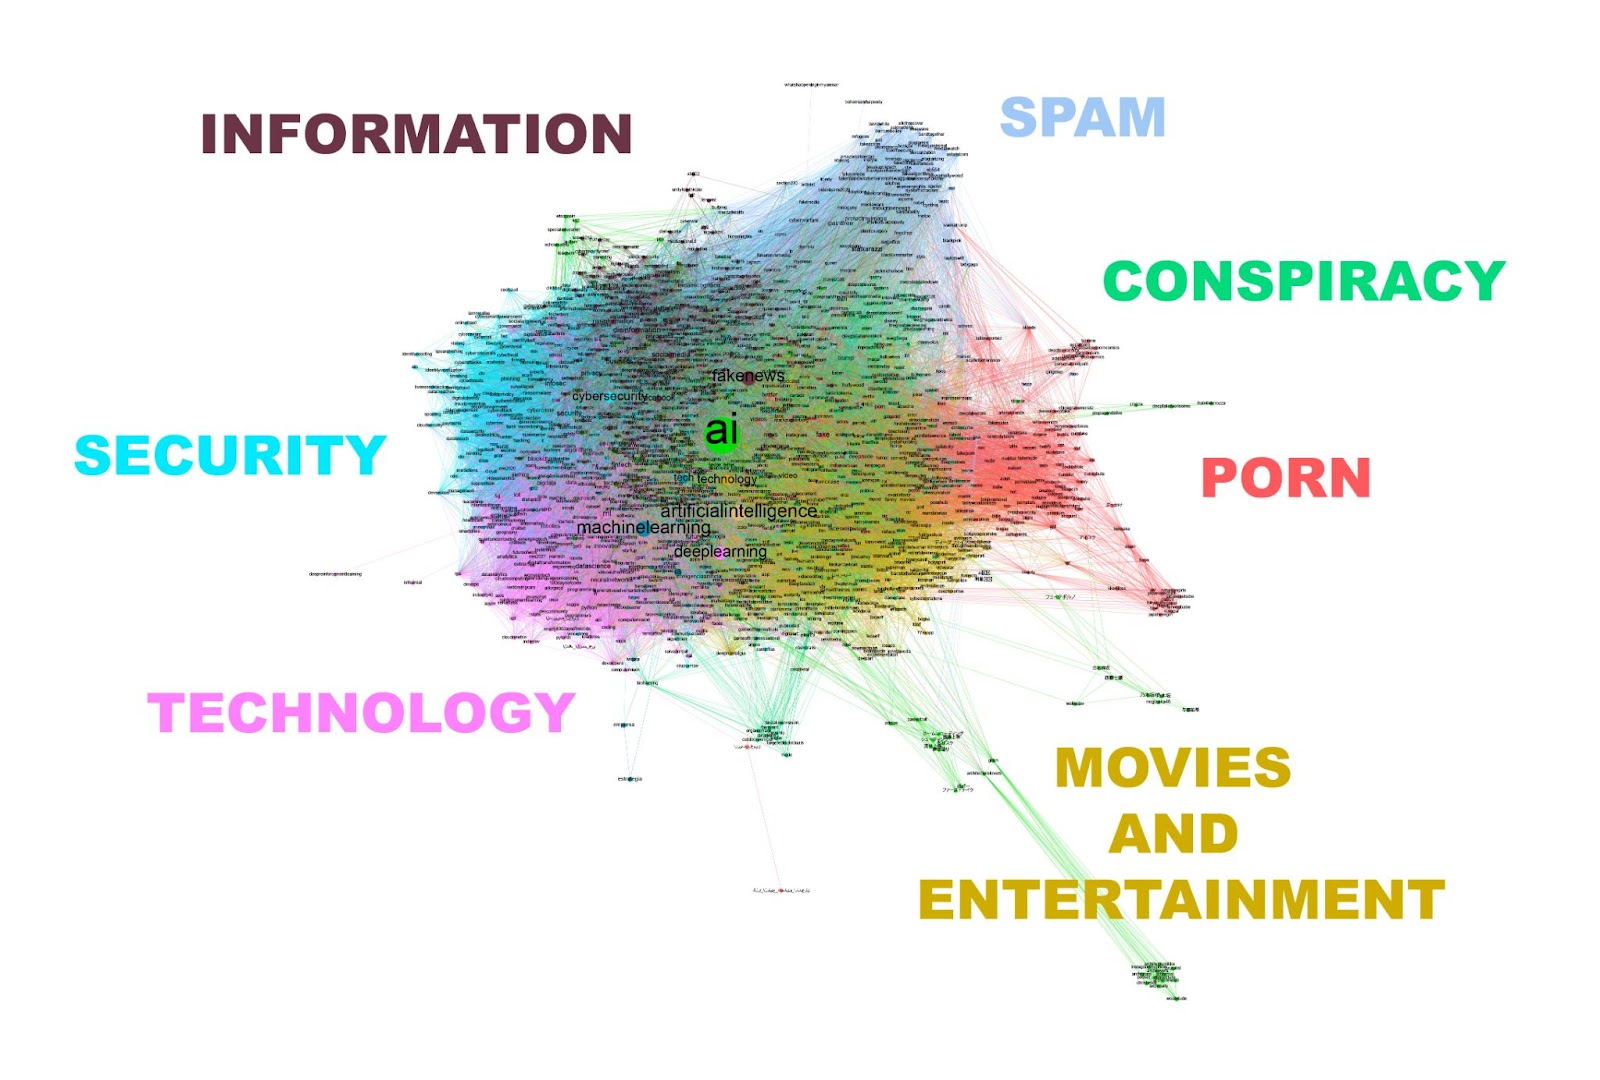
Figure 1. The main graph presenting the hashtags clusters 2018-2021.
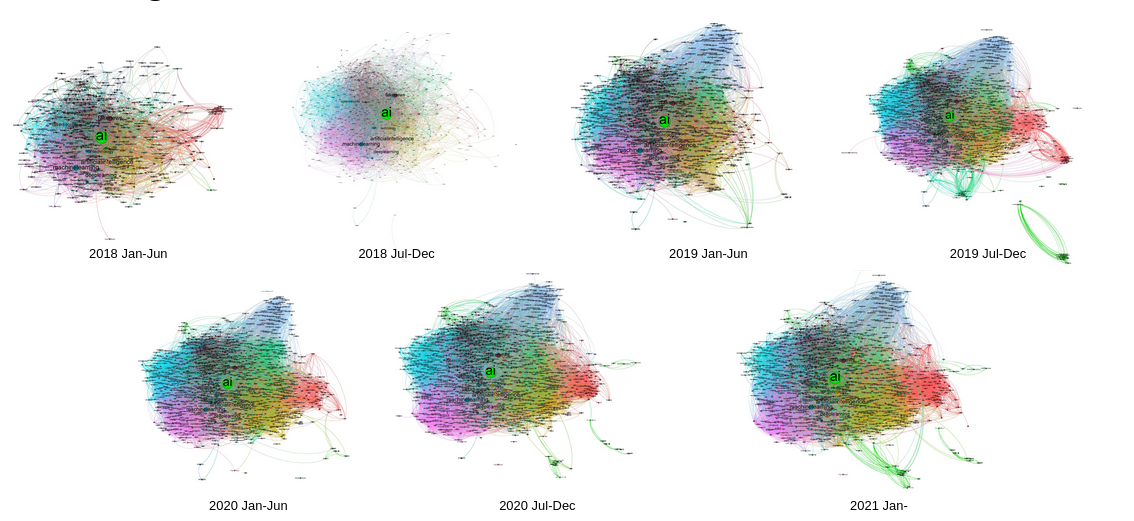
Figure 2. Graphs per six months 2018-2021.
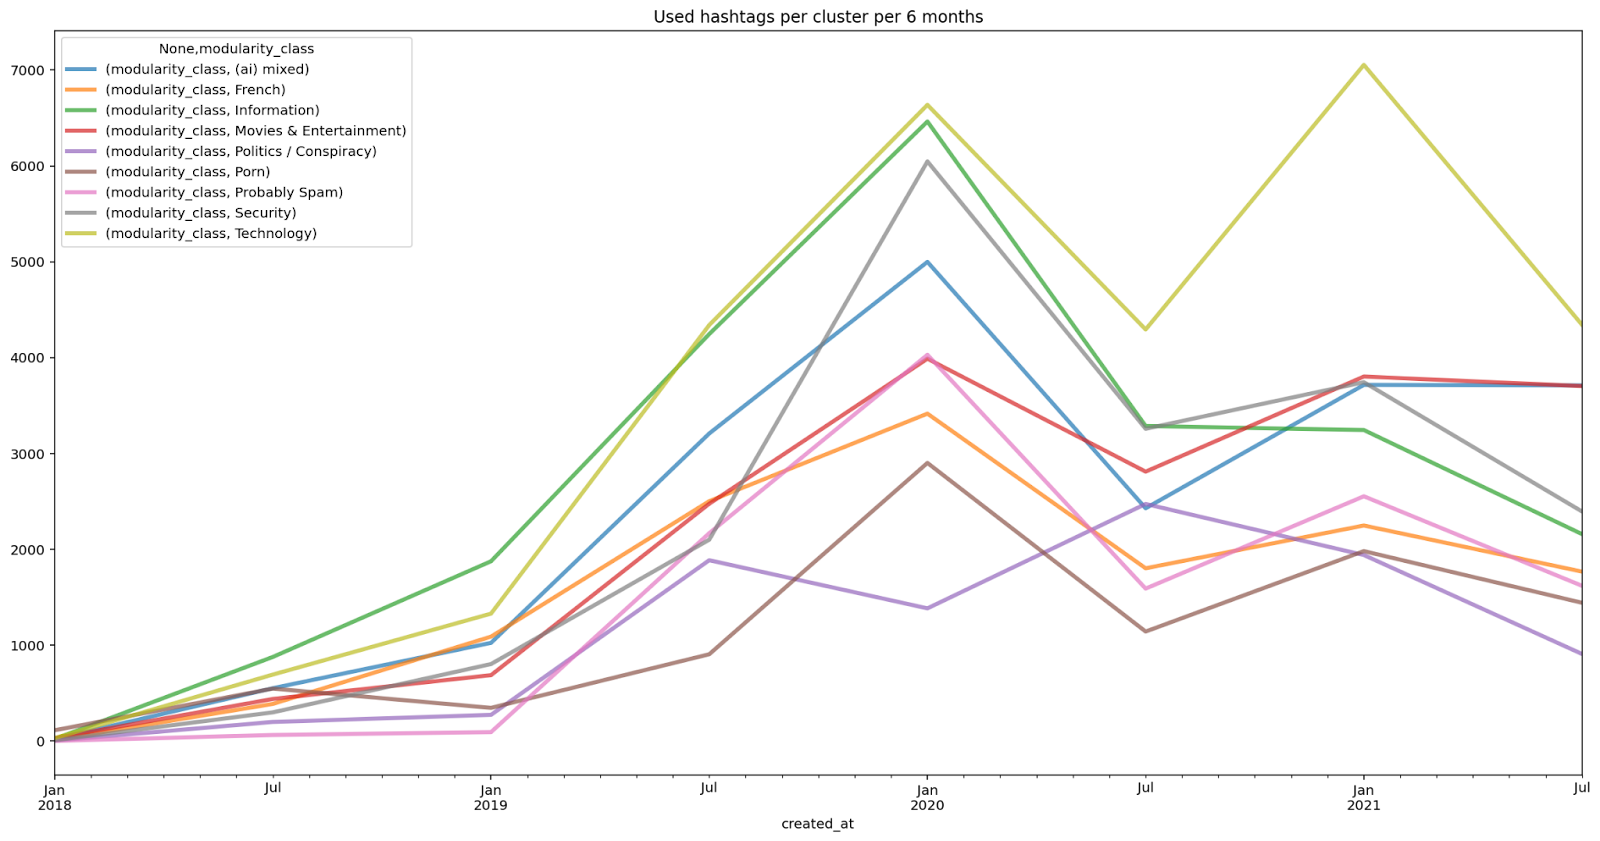
Figure 3. Volume per cluster per six months 2018-2021.
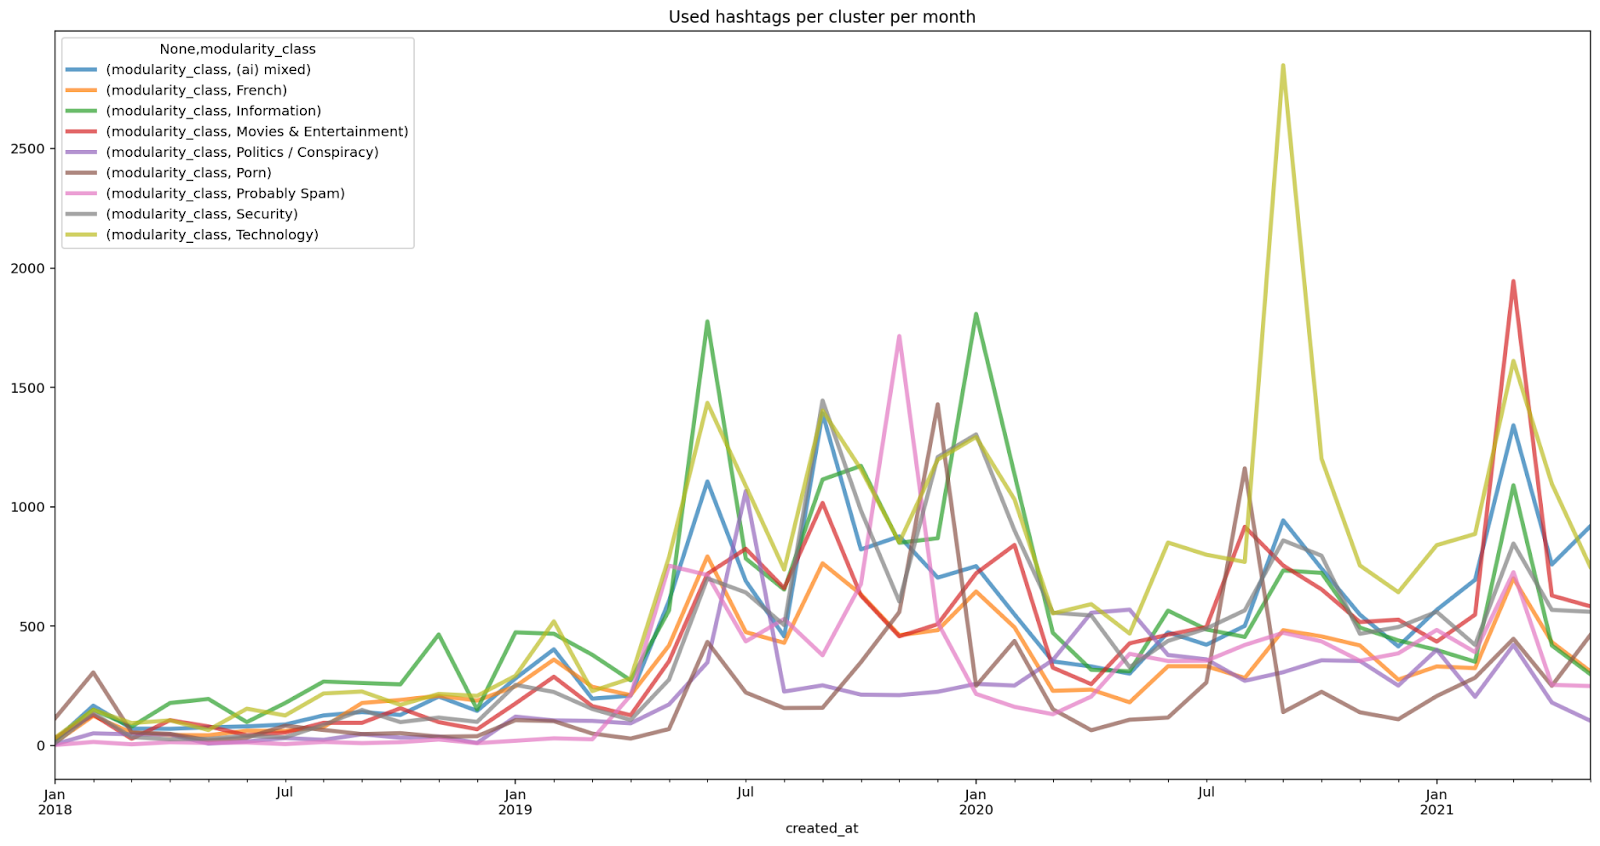
Figure 4. Volume per cluster per month 2018-2021.
5.1.2. Competing narratives surrounding deepfakes
As it emerges from the unigram and bigram analysis (Figure 5), the deepfakes discourses have changed throughout the years. However, we dispute that these discourse shifts are not necessarily evolving, but the different narratives around deepfakes co-exist and compete for a spotlight in the public debate. Then we can hypothesize different discourses as 'competing narratives,' which will presumably give us hints on the future paths of these technologies.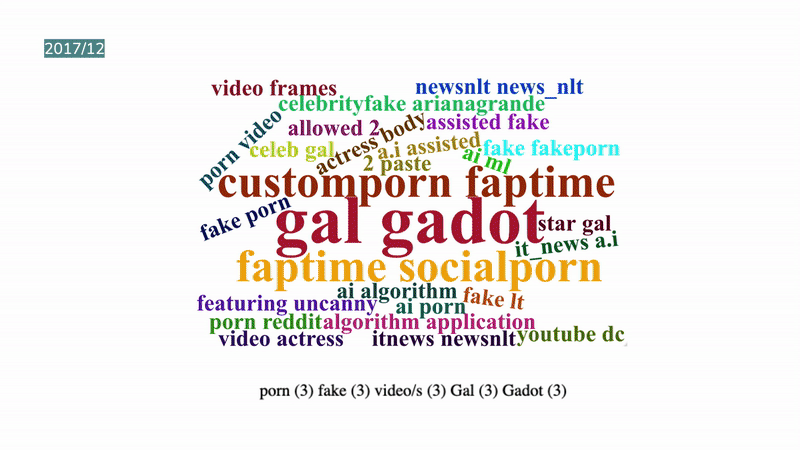
Figure 5. Word clouds of tweets about deepfakes by half-year periods. On the top is a bigram (generated using R) and on the bottom is a unigram generated using Tag Cloud Generator.
When deepfake emerged as a technology and a discourse by the end of 2017, highly explicitly references to female actors (ie.g. Gal Gadot) are the dominant key terms on twitter as, much like the advent of Photoshop in 1988, the nascent technology is deployed to make non-consensual pornography, underpinning Winter & Salter’s assessment that “deepfakes is fundamentally a tool for violating consent on the part of those whose faces and bodies are used” (Winter & Salter, 2019, 383).
In the following year, the victims of deepfakery shift from Hollywood’s leading ladies to the most powerful men in the world as Barack Obama calls President Trump a “dipshit”, supporting the general consensus that the “the most frightening applications of deepfake technology...may well be in the realms of politics and international affairs'' (Chesney & Citron, 2019). Arriving around the same time of global revelations about Chinese bots and Russian electoral interference, deepfakes landed at the height of the information disorder (Bounegru et al. 2018) and discourse took on a rasping, war-like rhetoric with bigrams such as “arms race” and “losing battle” entering the top 50 word lists.
To counteract the dystopian tone, “Cybersecurity” becomes a dominant narrative through 2019-20 as calls to mitigate the threat of deepfakes prevail, culminating in several blockchain-related products (including crypto”, “Bitcoin'' and “Tether”) all making the top 50 comments. Blockchain is situated as a technological panacea because the immutability of a distributed ledger allows for audio and visual content to be authenticated (Chesney 2019, Watson. & Galle, 2021), however, blockchain has a history of hype and bluster, and while the technology has obvious potential, this sort of technological solutionism (Morovoz, 2013) may be interpreted as Silicon Valley venture capitalists orchestrating the narrative.
Concurrent to the blockchain evangelism, in 2020, deepfakes transcend their non-consensual and controversial origins to penetrate the most popular and commercial content on the planet, intersecting with Bollywood, Disney’s new Star Wars spin off tv show, The Mandalorian and Queen Elizabeth’s Christmas Day national address. The shift from highly gendered, illicit content intended for the male gaze to the most powerful publishing institutions in the world underpins deepfake’s evolution from provocative plaything to highly lucrative industry. Indeed, the term “deepfake” slowly decreases in popularity, as the technology is rebranded as the much more productive and profitable term, “synthetic media” (Ovadya & Whittlestone, 2019).
5.1.3. The main sources orienting the deepfake debate
The URLs analysis is functional to have some insights about the various sources pushing the issue of deepfakes. As shown in the graph (Figure 6), the categories of URLs change over the years. As the starting point of discussion about deepfake, 2017 saw few contents related and the discourses were basically porn-centered. Porn kept to be a main topic in 2018, yet in the same year, introductive news about deepfake was a great proportion, most of which was brief introduction about deepfake as a new technology, the basic principle of AI face-changing, and its application in related disciplines, showing people’s curiosity about the technology. This orientation changed slightly in 2019, when introductive news gave way to media contents reviewing the developing history of deepfake, from its original rise in porns to the possible application in faked political news. The following 2 years were filled with warnings about negative effects of the technology, experts and professionals tried to cause public alarm about the potential risk behind deepfake, especially in the fields of international politics and personal information security. Practical application also began to draw public attention. Websites providing deepfake related services began to draw people’s attention. From 2020 on, there has not been any dominant category, especially in contrast to the years before. However, anti-techs, including technologies detecting deepfake and practical strategies in daily life emerge, representing a new era of the debate around deepfake.
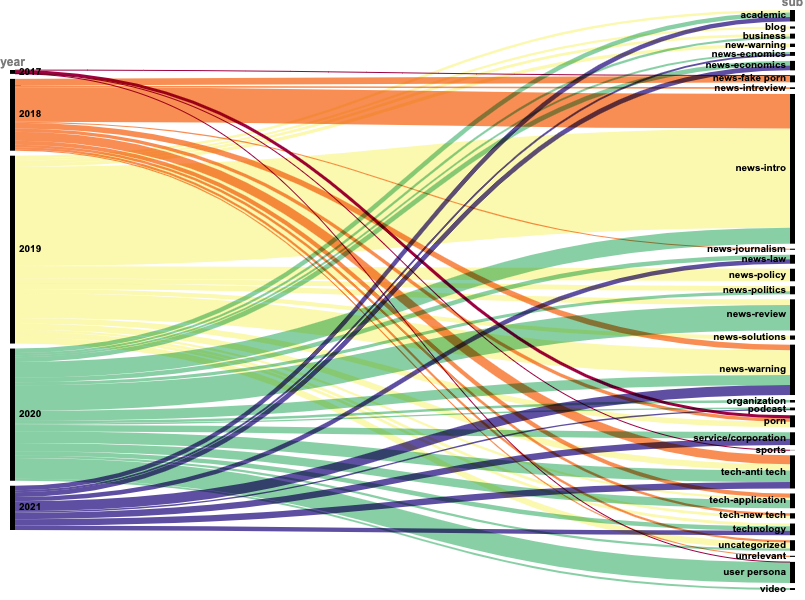
Figure 6. The change of URL categories over time.
Generally, we see a high discontinuity of hosts around discourses about deepfake over the years, except for the spamming one (Figure 7). While this definitely shows the shift from porn to more technological or political discourses, it may also imply that there are actually seldom information resources strong enough to have a continuous impact over the discourses overtime. Besides, the small variances in heights of each line also shows that not a single resource can dominate, implying the discourse may be a de-centralized one, at least for these external resources (Figure 7).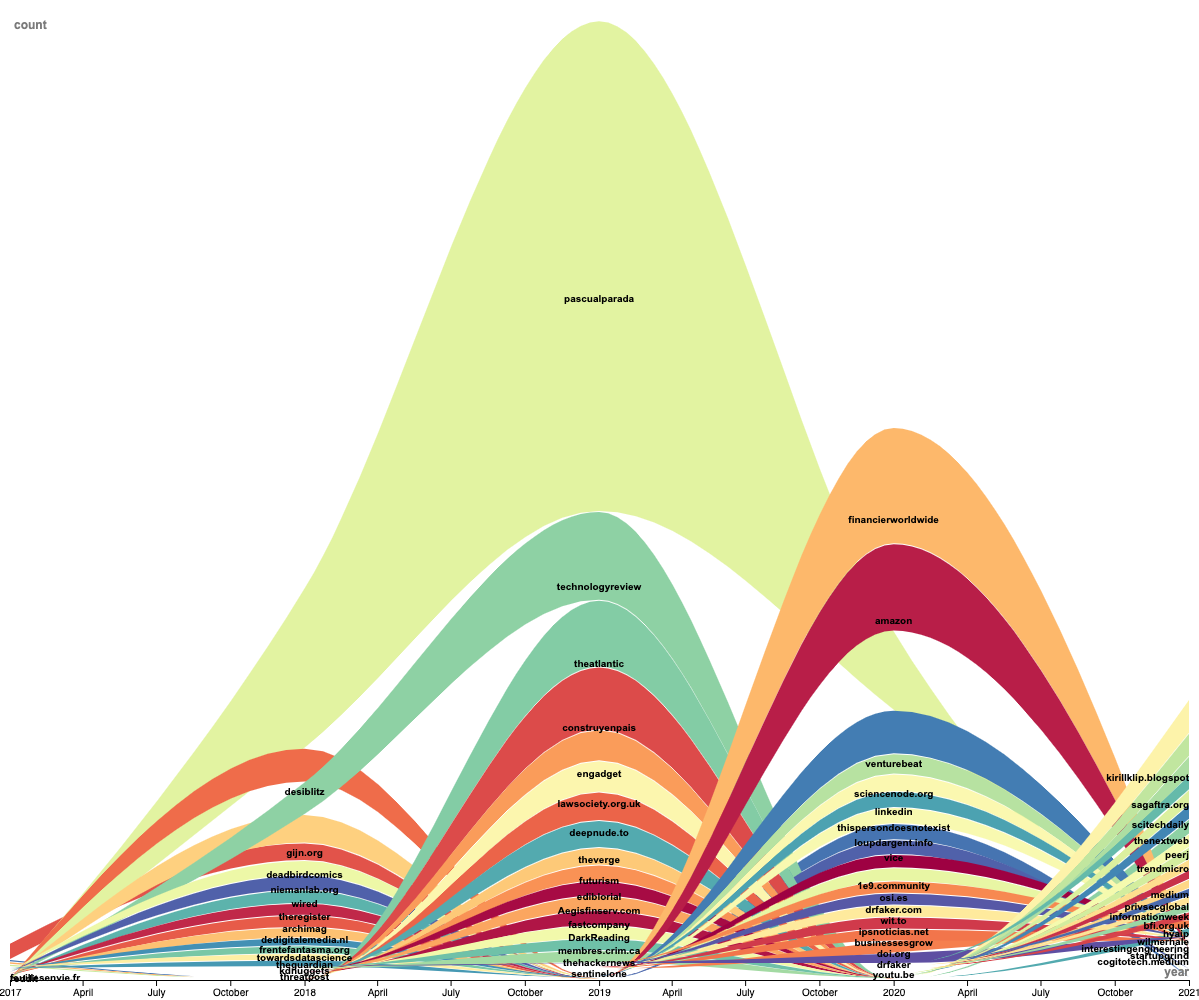
Figure 7. Overtime change of URL hosts.
Going more in depth with the qualitative analysis of Twitter URLs, the results show that in 2017, an adult-comic website takes the center stage. From 2018 on, an article introducing deepfake spams for the following three years (Figure 8). Together with it are other media websites, including technological updates on deepfake, news around the technique, and related reviews. This remains similar for the next three years. The difference is that from 2019, some websites providing practical applications of deepfake are drawing people’s attention. For example, a Chinese mobile application named Zao offers a way for ordinary people to put anyone’s face on a celebrity’s body in videos without writing programmes themselves. Another website named “This Person Does Not Exist” shows plausible pictures of non-existing people composited by algorithms.
From the year 2018 on, different resources have been referred to when people are talking about deepfake. The moral panic about the potential danger of deep fake technology takes grip. The spamming article “Deepfakes: an example of the misuse of artificial intelligence” taps into the dystopian notion -- motivated by a century of sci-fi -- that AI will somehow be the downfall of human civilization. The dystopian narrative continues through 2018/9 as the impact of deepfake is a concern not only for the most powerful (Obama) and glamorous (Bollywood stars) people, but ordinary folks too, as morality and truth-itself come under attack from this menacing, unregulated technology. That said, pulsing through the dataset is a positivist rhetoric about detection and regulation. Some of the top urls in 2018, 2019 and 2020 respectively, advise on how to spot a deepfake, support twitters “war” on deepfake, and celebrate how (AI) detection technology has advanced so much that deepfakes are not a societal concern at all. This tech solutionist perspective (Morozov, 2013) vs visions of dystopia (Lanier, 2008) is a familiar trope that pulses through much technology discourse.
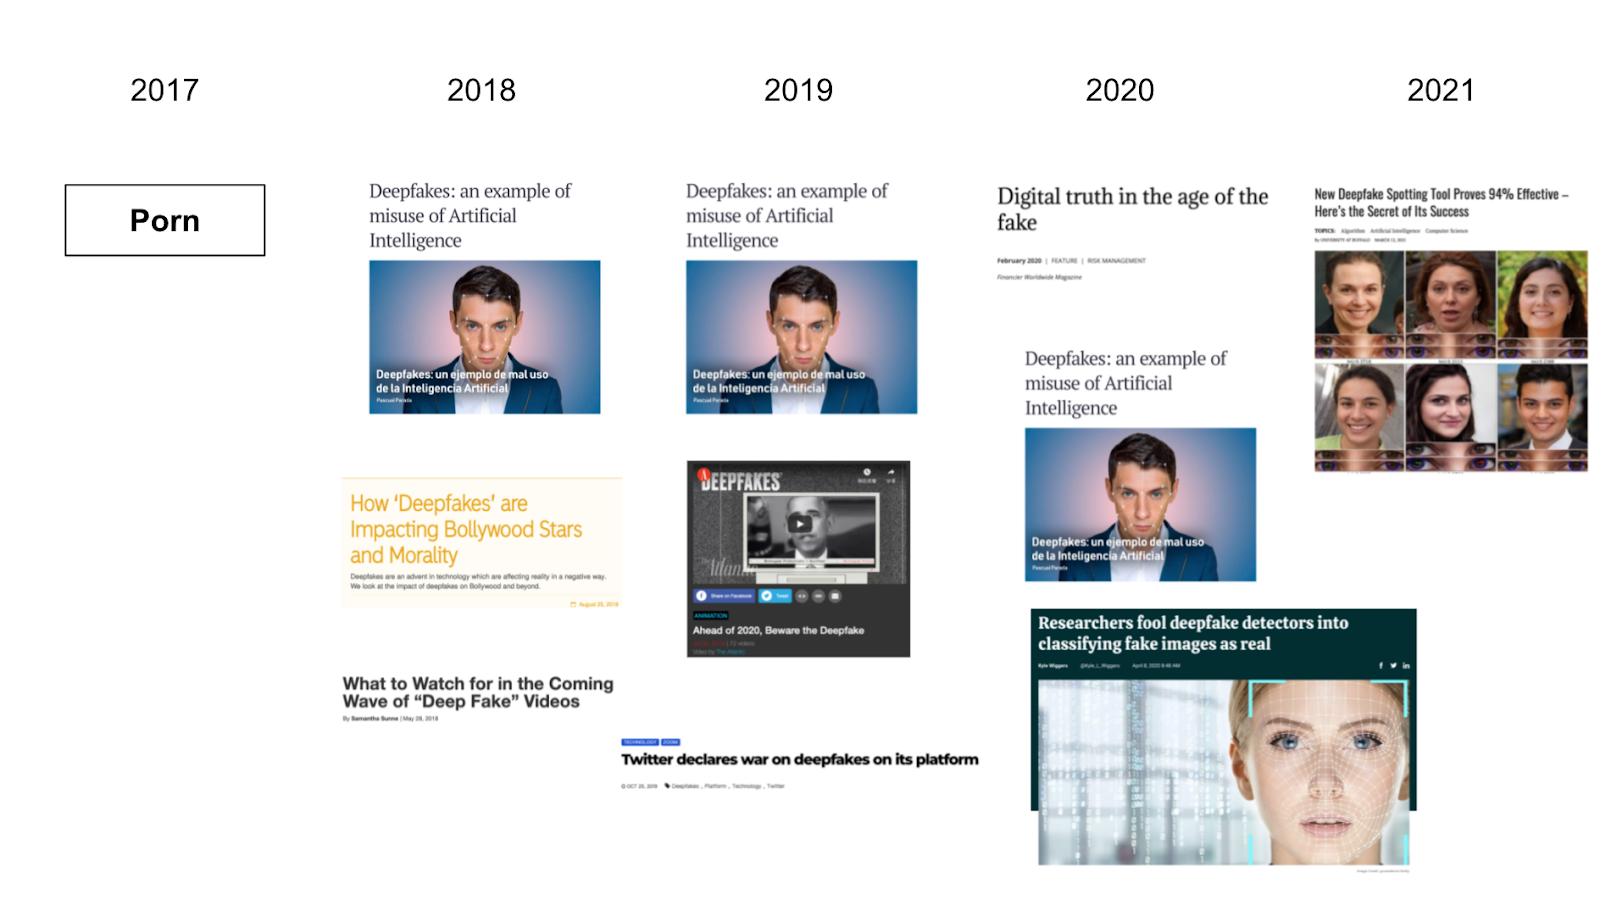
Figure 8. Top resources 2017-2021.
5.1.4. Who is discussing deepfake technologies? Most engaged and influential actors on Twitter
Most influential users
By far we could notice that the discourses around deepfakes do not yet give us a clear picture of a broader usage of this technology in our society and its effects. Instead, an important point that could be seen are the imaginary futures that the deepfakes enact on different actors. These narratives of expected usages of deepfakes range from a dystopia or a “signal an information apocalypse” (Paris and Donovan, 2019) to creative and innovative uses of deepfakes in the audiovisual creation (see Figure 9). As seen above, these noticeable divergences among the discourse tones can be seen as competing narratives, that is, divergent ways of addressing the issues around deepfakes.
Within the most influential Twitter accounts on the deepfake conversations, we could also access that the competing discursive attitudes towards deepfakes are also linked to certain types of actors. As seen above (Section 4.1.4) as a proxy to ‘influence’ we have considered the number of retweets, and then selected the top ten most retweeted by each year (for a total amount of 50 tweets and 33 unique accounts). The total sum of Retweets, within our 50 Tweets in our ‘most-influential dataset’ is 279.110 Retweets, with an average of 5582,2 RTs per Tweet, and a range of 41.650, and a median of 2060.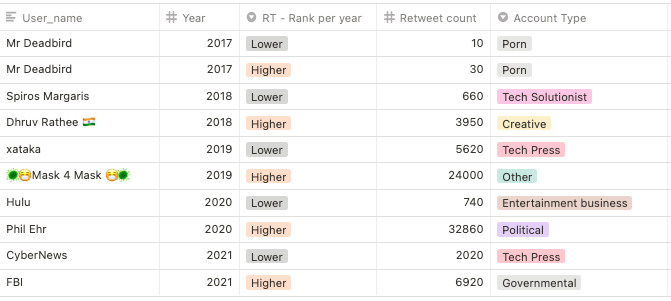
Table 2. The top and bottom from the 50 most influential tweets per year.
The most influential actors involved in the deepfake debate are governmental; politicians; mainstream media; creatives; entertainment business; tech-related press and organizations, and porn accounts.
For instance, governmental, mainstream media, and politicians accounts tend to have a more negative, warning, and dystopian attitude; academic and specialized media profiles tend to a more neutral and informative attitude; content creators and entertainment accounts tend to a more positive and creative usage of deepfakes (see Figure 9). Hence, we can assume that political and economic interests propel these actors' discourse framing, e.g., the entertainment segment might be interested in using the deepfake technology to make computer graphic, audiovisual effects cheaper, then a more positive discourse is found on that actor's group.
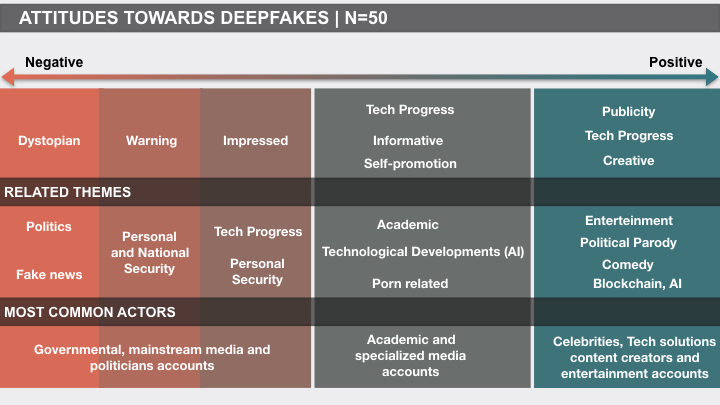
Figure 9. Most influential accounts and attitudes towards deepfakes.
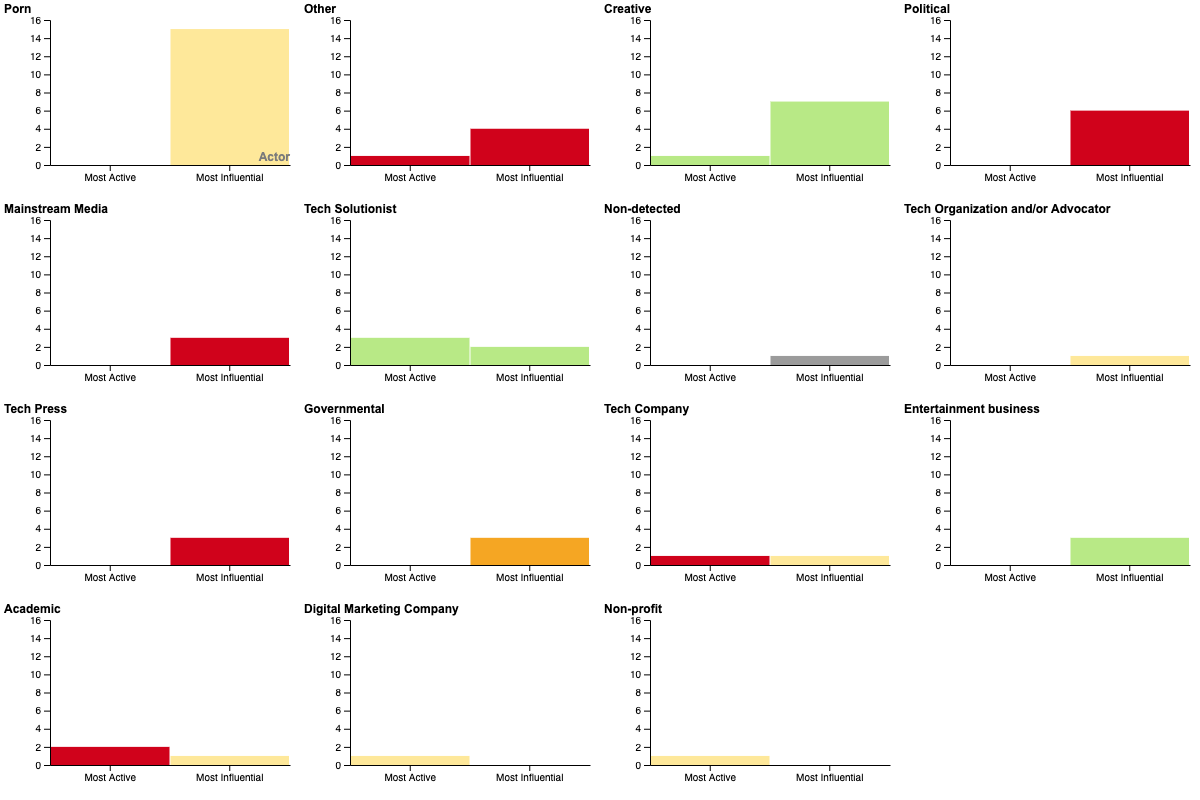

Figure 10. Made with Rawgraphs these bar graphs show the distribution of type of actors and sentiment towards deepfakes among the most active and most influential accounts analyzed.
Conclusively, we can hypothesize that in a way or another, the different narratives orbitate around different economic and political interests, and they battle to find a way in the future of media production.
Most active users
From 95.831 tweets in our dataset 4.615 are from the top 10 most active accounts, which represents 4% of all of the tweets. Other than that, we have 46.987 unique users, then only 0,02%—the 10 most active profiles—are responsible for 4% of all of the content posted. Within the whole dataset we have a mean average of 2,03 tweets per user (N=95.831 tweets). As for the dataset only with the 10 most active users (N=4.615 tweets) there's a mean average of 461,5 tweets per user. Hence, we can hypothesize that the most active users have an odd behaviour while comparing to the others.
Most of the tweets made by the top ten most-vocal profiles are repetitions, some use the exact same content over and over. Other times, the same structure is present. These accounts seem to align with the “spam” cluster, found in the hashtag analysis (see Figure 1, Section 5.1.1).
It is worth noticing that the most active users (identified by the number of tweets) and the most influential (identified by the amount of retweets) do not correspond to the same profiles within our dataset—with exception of ‘@Spirosmagaris’, an influencer and verified account within the tech solutionists actor cluster. Besides this unique case, they seem to have very distinct online behaviours. The most influential ones do not post much on the issue of deepfake, furthermore, on the posted contents they are likely to convey a clearer standpoint on the deepfakes issues. Moreover, the most influential have an intuitive positioning and attitude towards deepfakes (e.g.: entertainment business having more positive and creative attitudes). On the other hand, the most active accounts are mainly users with the intention of self-promotion, with a spammy behaviour, then neither the attitudes nor sentiments towards the deepfake issue seem to have much relevance to the most-vocal actors.
For instance, the user accounts “Pascual Parada” and “Blogging Guide” have posted the same exact text, URL and hashtags more than five hundred times, both trying to promote a service or product they sell online using a brand content strategy. Other accounts among the most active ones are less evidently spamming, with more diversification on the text structure, but still with a lot of repetition. The accounts with more evident repetitions seem to have a semi-automated behaviour.
5.2 Image vernaculars and trends
5.2.1 Top images over time: visual themes and engagement
By looking at the top occurring images shared on Twitter, we noticed that the visual discourses around deepfakes show a decrease in pornographic content (from 2017 onwards) and an increasing attention to commercial softwares and security concerns - in line with the results emerging from the discourse analysis.
Interestingly, there are substantial differences between the top occurring images and the most engaged with (in terms of retweets). As we can see by comparing Figure 11 and Figure 12, in the top occurring images, a lot of what we discovered to be ‘spam content’ is shared. This insight further confirms the result from the url and user analysis: the most recurrent images are often shared by spam users, who are mostly seeking visibility by sharing over and over the same content, and by pointing at the same sources as references. In particular, we can see that the same image is posted hundreds of times by the same user, and it remains the top shared image for three consecutive years (from 2018 until 2020). Thus, the posting behaviour, rather than the visual content per se, is what really emerges from this analysis. On the contrary, in the top retweeted images, we can see that the representation of politicians emerge, thus pointing at a completely different discourse. Moreover, we found a lack of news outlet content in the top retweeted images (mostly sharing url-content, not images).
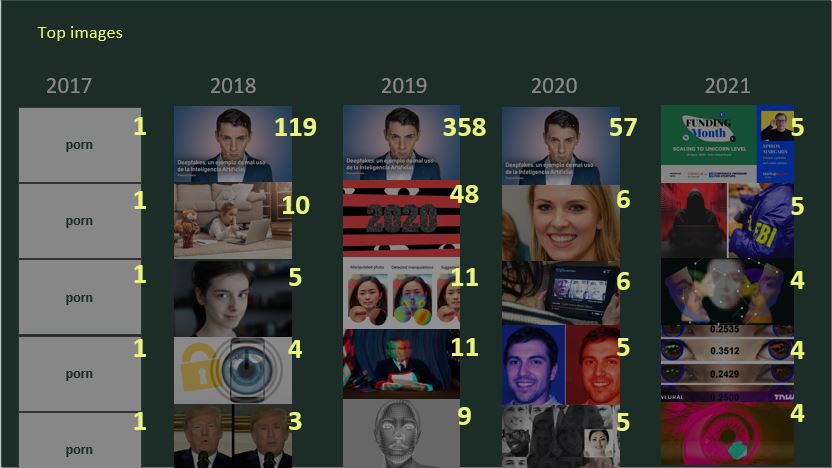
Figure 11. Top occuring images over years.
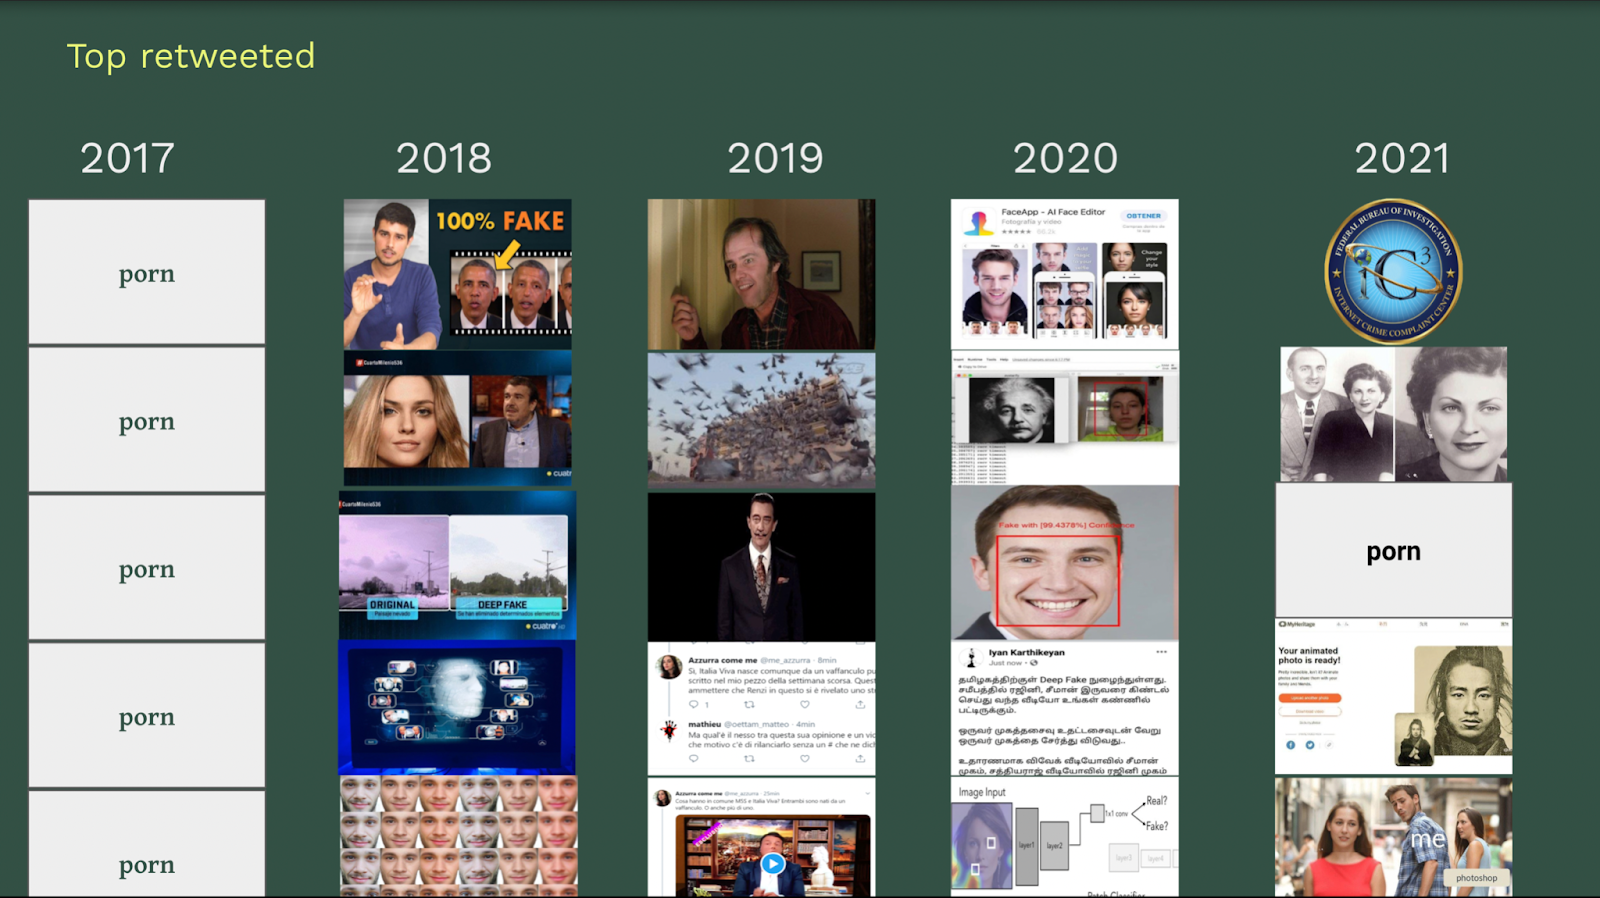
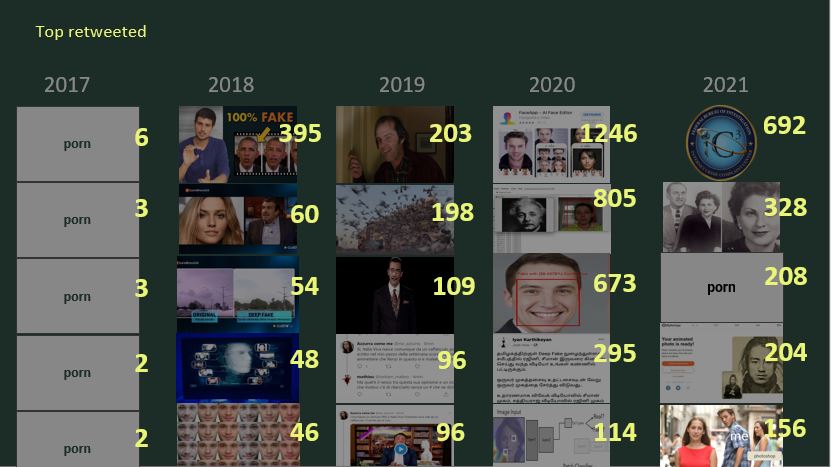
Figure 12. Top retweeted images over years.
5.2.2. Sorting images per color and platform by using ImageSorter
In the first part of the analysis we highlight the dominant and marginal clusters by looking at colors and themes over time.
The most extensive database that belongs to Google Image with Dutch geolocation settings, we found from 2017 to 2021, white and nude have always been the dominant clusters. On the other side, the marginal clusters are identified in green and blue. Therefore, no significant change in dominant and marginal clusters has occurred over time.
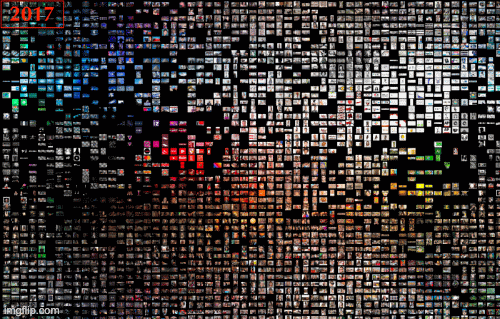
Figure 13. Overview, Dutch geolocation settings, 2017-2021, Google Images.
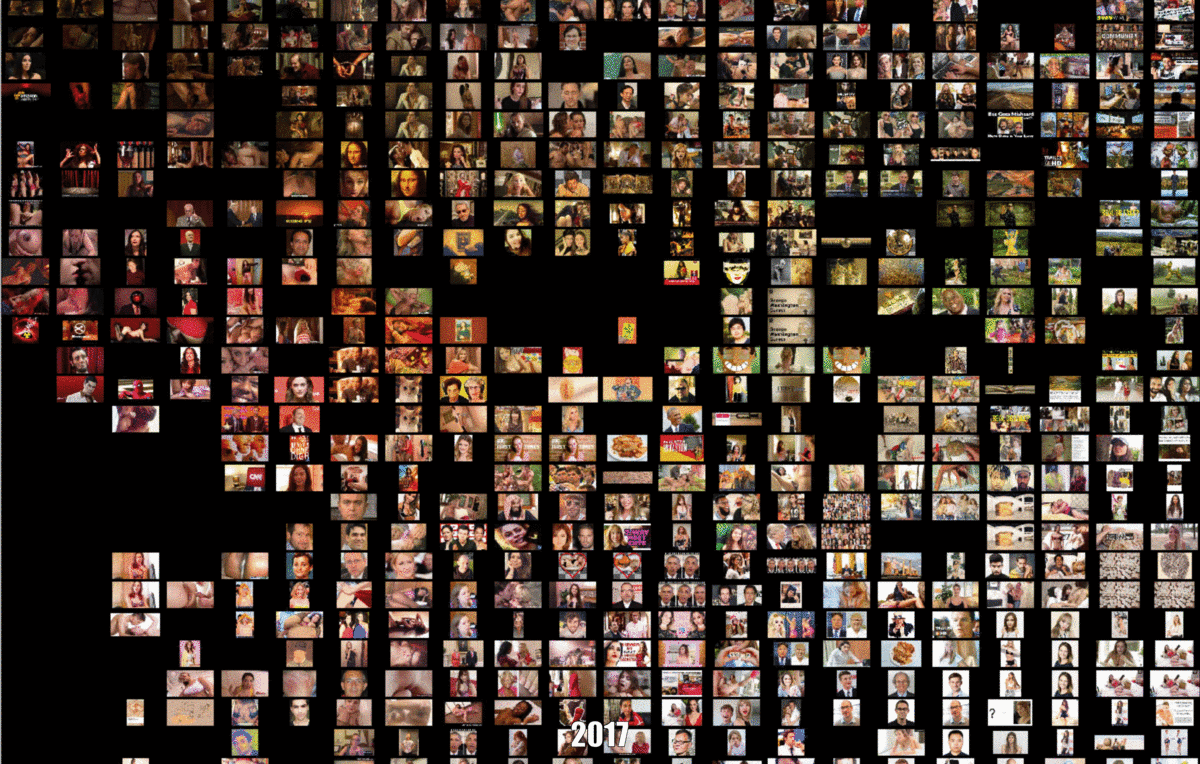
Figure 14. Dominant color clusters: white and nude/ Dutch geolocation settings, 2017-2021, Google Images.
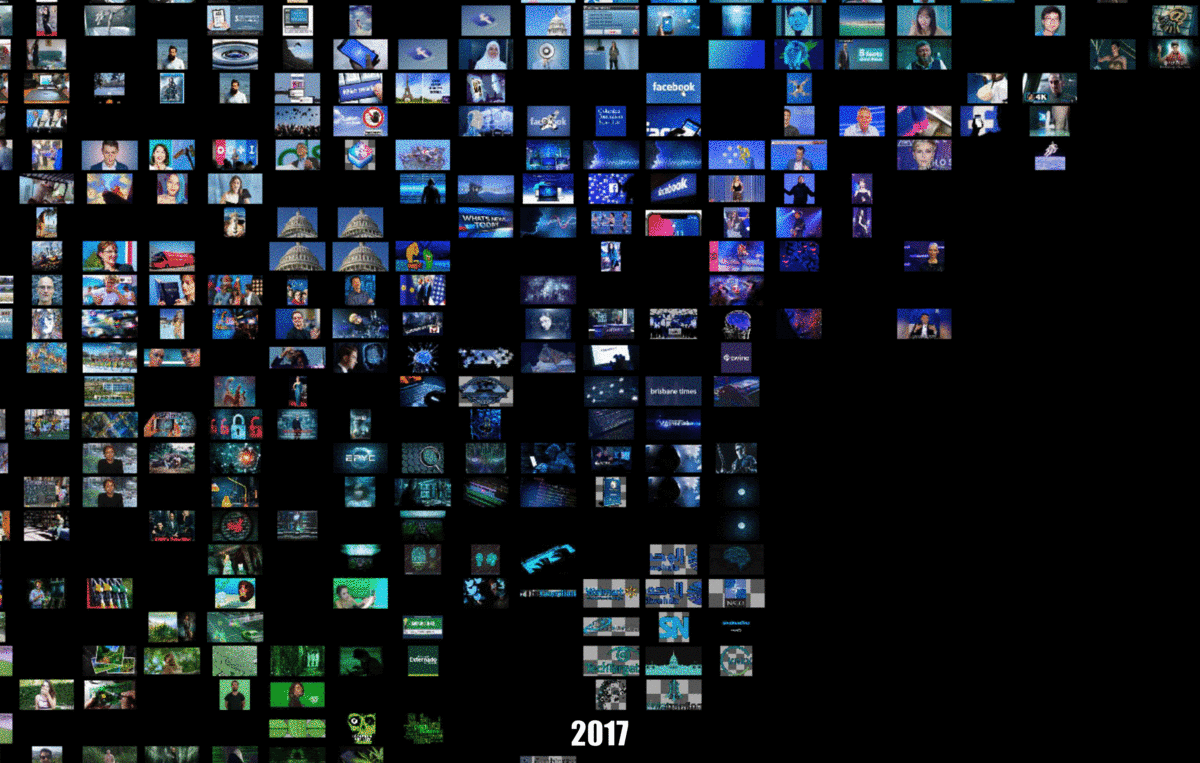
Figure 15. Marginal color clusters: Blue and green/Dutch geolocation settings, 2017-2021, Google Images.
Regarding images' themes, a considerable change is visible in this database. In 2017 the majority of images (nude clusters) can be categorized as pornography and erotic images. Since 2018, we found face swap images of famous people and politicians to circulate on Google Images. On the other side, Sci-Fi images and tech icons have always been the marginal themes (blue clusters) from 2017 to 2021.
To sum up, dominant themes in images with the Dutch geolocation settings demonstrate that the pattern of deep fake photos in Google Images has shifted from pornography to face-oriented images. Such images can be seen in various clusters. They open the line of empirical inquiry focused on warning fabricated images and raise awareness about fake content in the digitally saturated social context.
Accordingly, since 2019, part of the white cluster is allocated to content on what deep fake is and how to distinguish fake images from original ones. Increasing informative content can be in the direction of educating and raising users’ consciousness. On the other hand, such content is aimed at gaining profit for tech owners and actors.
The same analysis can also be done using datasets of Brazil/UK/US geolocation settings, where we find similar patterns related to dominant and marginal color clusters.
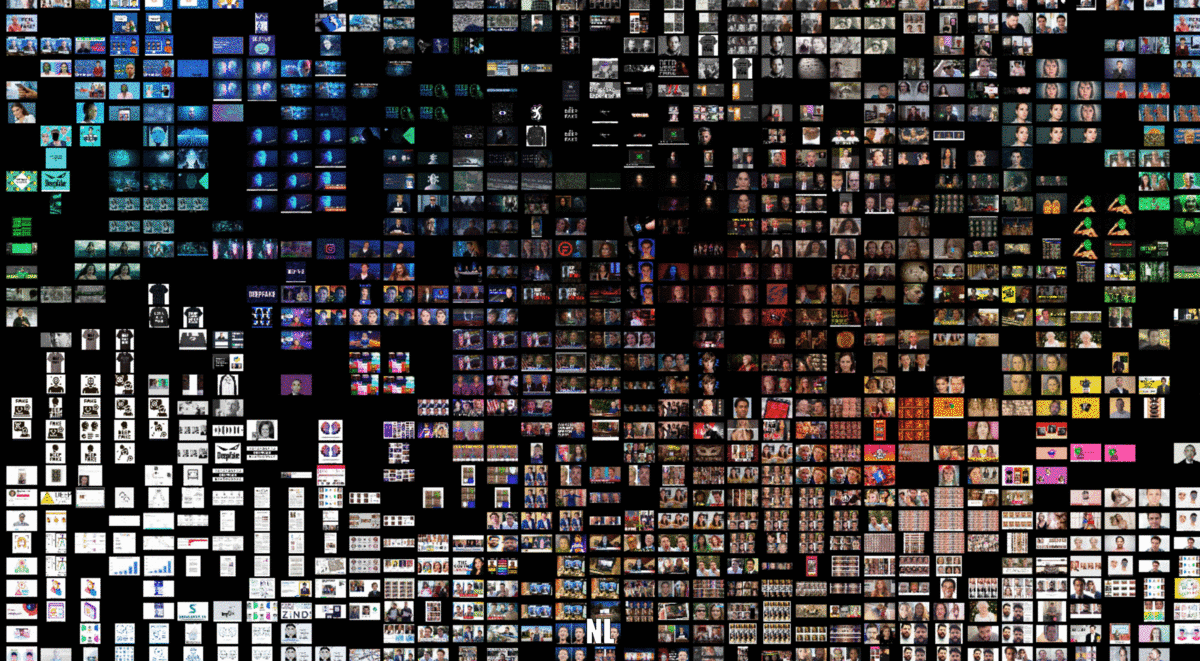
Figure 16. Contextual overview in 2021, Dutch, Brazil, Uk and US geolocation settings, Google Images.
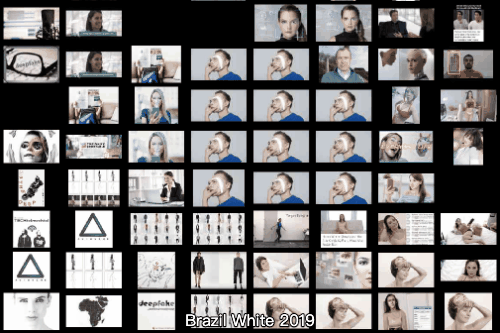
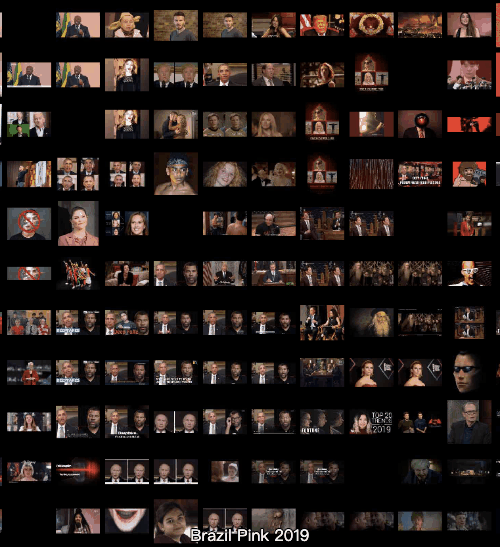
Figure 17. Dominant color clusters: white and nude/ Google Images, Brazil geolocation settings, 2019-2021.
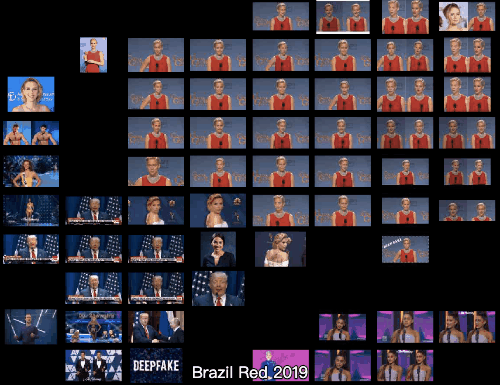
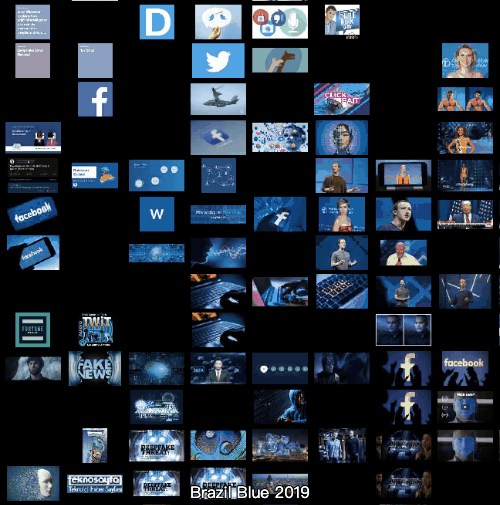
Figure 18. Marginal color clusters: blue and red/Google Images, Brazil geolocation settings, 2019-2021.
Moreover, we performed a cross-geolocational analysis, which shows slight geographical and cultural differences.
It is worth noting that, even though the faces of politicians have a high frequency in different contexts in the first half of 2021, it is less visible in images with Dutch geolocation settings rather than others. Generally, faked images of politicians' faces (mostly men) in the US, UK, and Brazil are quite the same (the images of American politicians are the most circulated ones).
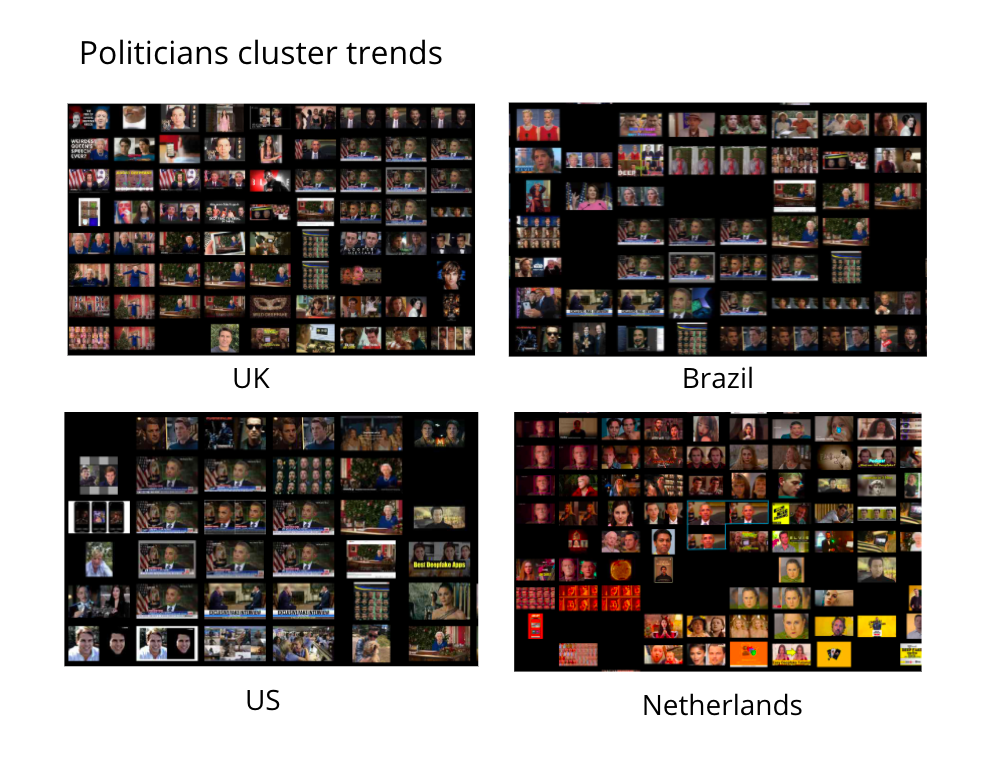
Figure 19. Politicians cluster trends.
Regardless of location, the clustering of visual content through Imagesorter enables us to understand how image trends change over time in the Google Image datasets:
Interestingly, we were able to identify not only image trends and patterns, but actual visual discourses, that share with the Twitter discourses and competitive narratives a similar evolution, from pornography to informational and warning content in the form of images.
Lastly, we paid attention to the emergence of specific platform vernaculars, by comparing Google Image and Twitter data, in a preliminary cross-platform analysis.

Figure 20. Overview, 2017-2021, Twitter Images.
In Twitter datasets, the nude cluster is expanding from 2017 to 2020. In 2021, it declines slightly, but still remains the dominant cluster. Both faces and pornography images could be found during the whole period.
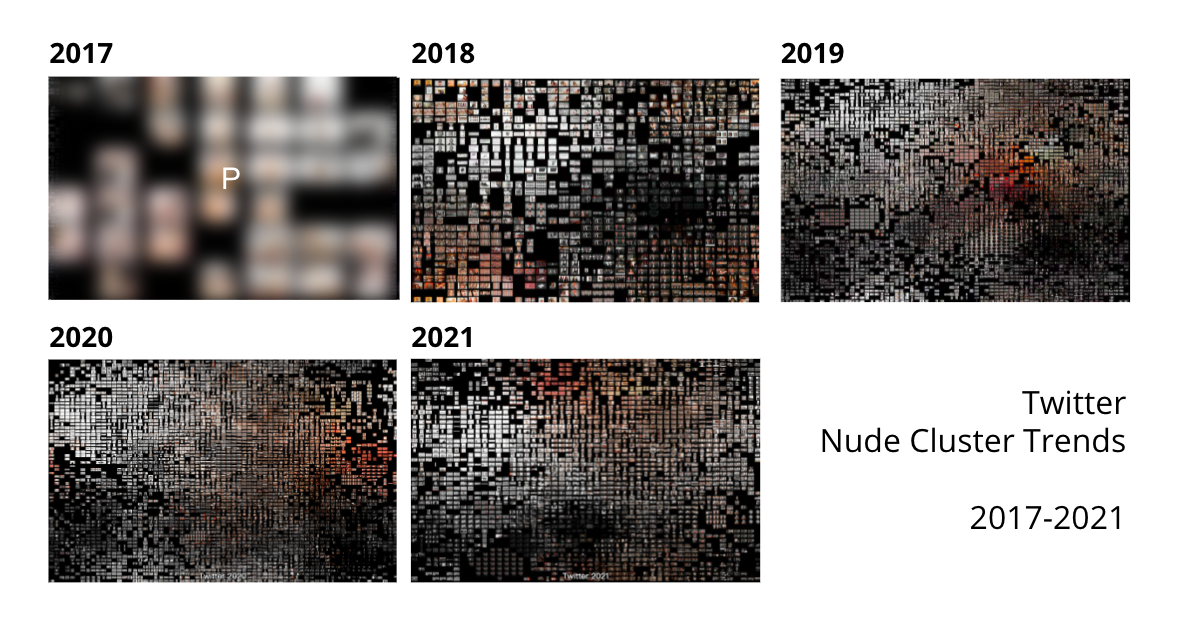
Figure 21. Twitter Nude Cluster Trends (2017-2021).
As analyzed previously, prevalence of pornographic images on Google Image have become diminished and replaced by face swap images since 2018. In contrast, pornographic images on Twitter are still popping up. This might be a clue for different content moderation policies adopted by Google and Twitter. It seems that de-contextualization, content policies, and moderation practices in Google are connected to nudity and sexual display (Spišák et al., 2021). In this regard, pornographic images are defined as not safe for work (NSFW) content in Google guidelines (Footnote 1), and deepfake pornography moderated and removed since 2018 (Burgess, 2018; see also Section 5.3.2). What is seen in this ubiquitous and influential Internet platform is a set of practices aimed at governing sex. Without a doubt, pornographic images and nudity brought legal and ethical challenges, especially when it comes to the matter of deepfake. On the other side, content moderation and the de-platformization of sexuality, which are done to provide a safe digital platform, have important implications in terms of human rights.
Footnote 1. Sexually explicit images are defined as “Written or visual depictions of nudity or graphic sex acts, with the exception of nudity for educational, documentary, or scientific purposes” (Google, n.d.:8).
5.2.3. Thematic cluster analysis
With the thematic cluster analysis we were able to group Google Images over time by using PixPlot. Such grouping allows us to grasp the main themes and individuals represented in the datasets by looking at the emergent similarity clusters. As Figure 22 shows, the most relevant clusters are those relating to pornographic content, celebrities and politicians, explanations of machine learning and demonstration videos. In 2018, clusters relating to "Deepfakes apps" (i.e. tools for producing deepfakes) are present, together with the cluster "How to spot Deepfakes" (tools for detecting deepfakes).
Similarly to the results found in the colour analysis (see Section 5.2.2.), the main characters represented among the various thematic clusters are politicians, such as Obama, and secondarily Trump, and some other prominent figures in the social media landscape, in particular Mark Zuckerberg. Interestingly, Obama and Zuckerberg images are the most commonly used for content showing examples of Face Mesh.
Moreover, images of women (ordinary women rather than celebrities) are used extensively in the representation of deepfake in pornography and faceswap. In contrast, men (mainly celebrities or politicians) are not depicted at all in the pornographic cluster and in face swap cluster. Therefore, a clear gendered pattern appears in the kind of content found in Google Images: women are mostly the subject of pornography, whereas men are on the one hand those who have power in society (e.g. politicians) and technical experts. It can be said that the discourses around deepfakes, and deepfake technology in itself, seems to reify gender stereotypes already existing in our society.
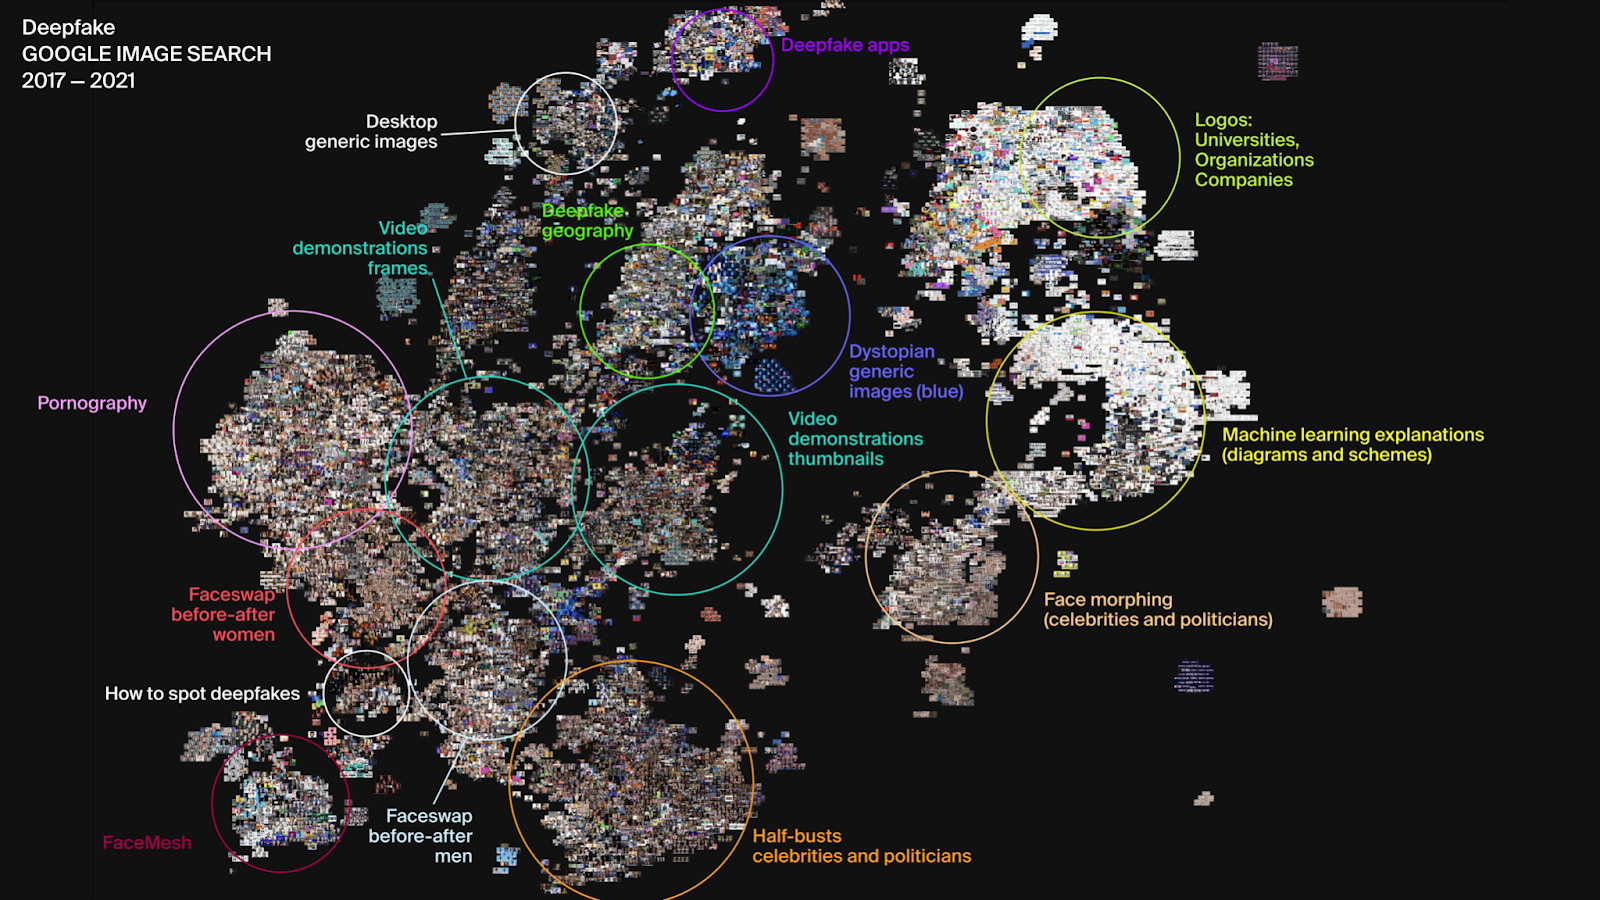
Figure 22. Google Image Search, 2017-2021.
Secondly, we aimed at comparing how the visual representation of deepfakes change not only over time, but also per platform (Figure 23 and 24).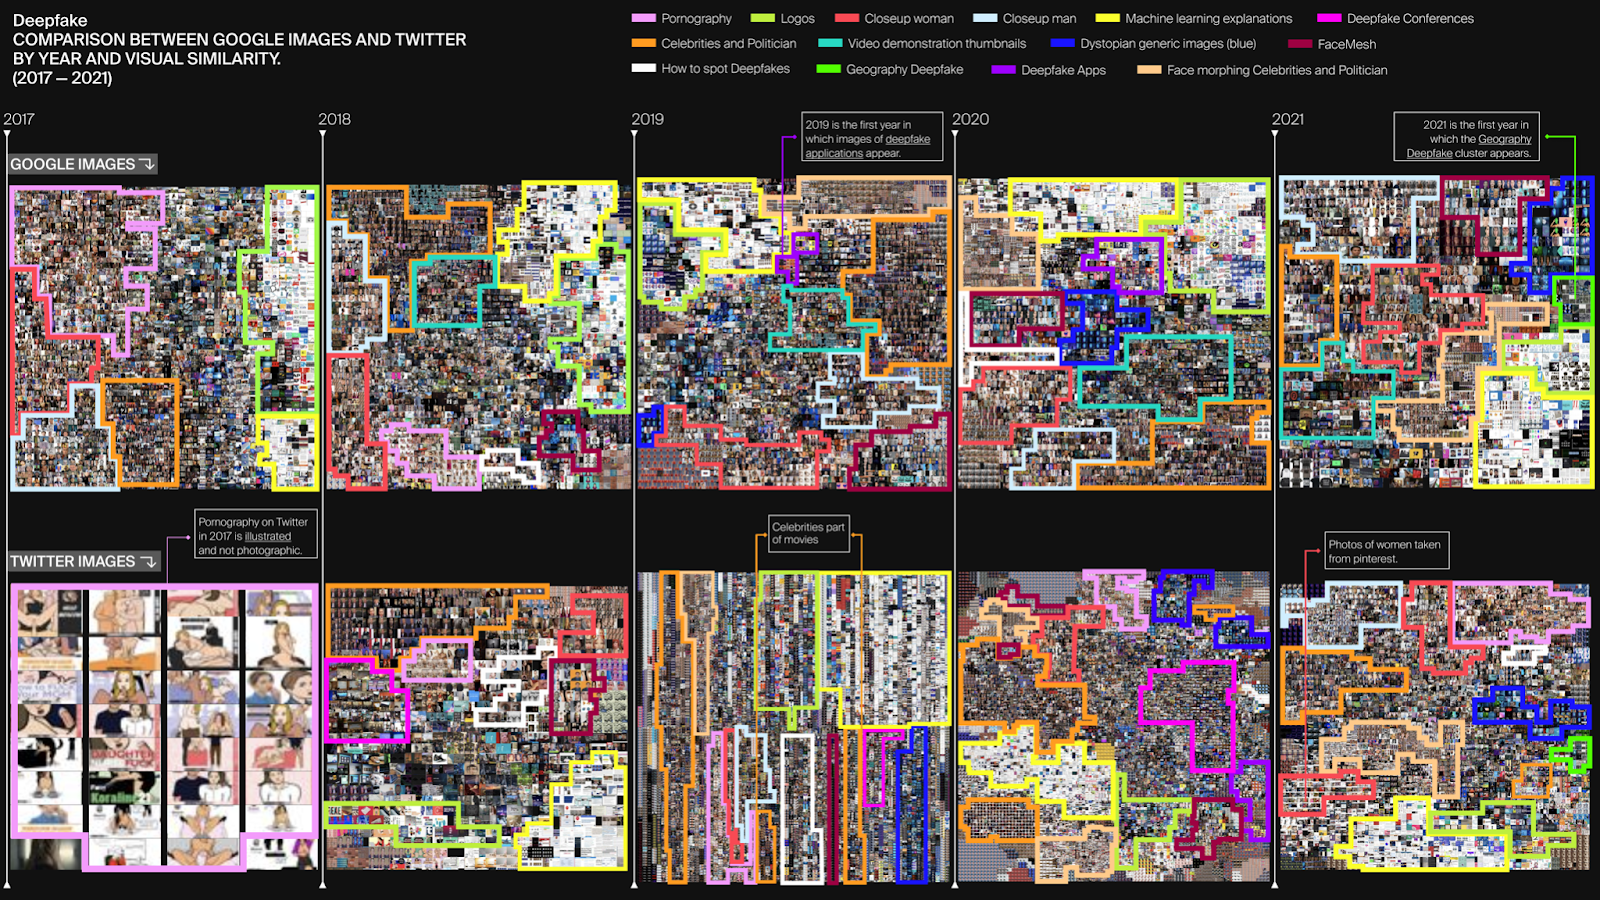
Figure 23. Comparison between Google Images and Twitter by year and visual similarity.

Figure 24. Comparison between Google Images and Twitter by year and visual similarity.
While for Google Images, pornography is a trend custer only in 2017 and 2018, for Twitter, 2017 presents illustrative pornography that over time conforms to Google's visual pornographic imagery and remains constant over the years.
In 2020 and 2021 a new type of representations appeared both in Twitter and Google Images, what we called ‘geography deepfake’, namely images with the manipulation of AI technology used to remove or add elements from a satellite map to create a new false satellite image.
Between 2018 and 2020, Twitter presents a ‘deepfake conferences’ category, which is not present in Google Images. In 2021, these images are no longer present, probably because of the coronavirus pandemic. This difference can be due to Twitter’s specificity as a platform and one of its typical uses in terms of networking. Moreover, on Twitter, alongside Obama, Mark Zuckerberg (pertaining to the domain of politics), also prevalent in Google Images, the figures of Trump and Biden appear in high numbers. On the contrary, the cluster "Face-Mash" linked to the topic “How to do deepfakes”, is less present on Twitter than on Google Images. These two insights are somehow correlated: Google images presents various representations of some famous examples of deepfakes, in particular videos involving Zuckerberg and Obama, which usually play an important function in public discourse by exemplifying what deepfakes are, and what the possible dangers attached to it. On the contrary, we can assume that the variety of politicians represented on Twitter point to a more specific political discourse. The domain of art also emerges in both Twitter and Google images, especially with the presence of images representing the Mona Lisa.
Moreover, in line with what emerged in the discourse analysis (see Section 5.1.2 and 5.1.3), both Twitter and Google Images present a ‘Dystopian Deepfake Images’ cluster, characterised by blue-toned images depicting, for example, human figures in the form of avatars or images of space. This is present from 2018 onwards and shows an increase in subsequent years.
5.3 Computer vision
5.3.1. Google Vision web entities for Google images over time
We mapped and analyzed ego networks of key web entities in the network across the years 2017-2021 according to the themes ‘technology’, ‘pornography’ and ‘culture’. Within the technology theme, we noticed a movement towards conceptualizing deepfakes along the lines of their components as well as the technologies and media that make deepfakes possible. Over the past five years, technological terms in the image network have grown more diversified and specific, with individual algorithms growing their own clusters (e.g. ‘deep learning’ being surrounded by ‘generative adversarial networks,’ ‘artificial neural network,’ and others by 2020). For ‘face,’ a noticeable trend in the discourse is the movement towards conceptualizing deepfakes along the lines of its components and the technologies and media that make deepfakes possible. In the case of ‘security,’ one can see over time the shift from hardware/software to more embodied (even if in inauthentic ways) aspects of security.
Within the pornography theme, both the ego-networks on deepfake porn and xvideos reduce their size significantly throughout the years, especially from 2017 to 2018. This expresses the tendency observed in the preliminary analysis of top nodes, whereby pornography related nodes express a tendency to vanish compared to cultural and technical connotations. Further suggesting the shift in the meaning patterns of the term ‘deepfake’—from its original sense of AV manipulated pornography depicting celebrities to a broader techno-cultural term. The content of the images within the networks—both from ‘xvideos’ and ‘deepfake pornography’ reflects that aforementioned shift, as it moves from explicit pornographic images to another category of picture, one that mostly showcases technology with futuristic aesthetics.
Connected to the previous theme is the theme of culture as the ‘celebrity’ entity had a clear branch related with pornography in the beginning. However, pornography was maginalized in the network in the process of deepfake entering the mainstream culture. In terms of ‘art’, the deepfake technology refers to art paintings themselves, with classical works like Mona Lisa appearing in the nodes of each year. Deepfakes slowly penetrate the commercial sphere, with a number of relevant nodes emerging from 2017 to 2019 to show deepfake technology acting on the design of brands/products to influence commercial discourse. In 2020-2021, deepfakes are becoming more and more associated with images of people. As for ‘politics’, the ego network is of a massive radial shape with ‘Deepfake’ in the center. There are a couple of nodes that drift off from the primary ‘Deepfake’ nexus, typically involving a hyper-specific set of web elements associated with a particular image. In 2017 the politics cluster is much smaller, growing to its largest in 2018, and slowly becoming smaller through 2018-2021 to return to its 2017 size. The term ‘the president of the united states’ is a constant associated term throughout all years.


Figure 25. Web entity networks from 2017 to 2021.
We chose to zoom in on the web entity ‘deep learning’ for further analysis over the years 2017-2021 (Figure 26).
Figure 26. ‘Deep learning’ web entity network from 2017-2021.
‘Deep Learning’ has a 2017 ego-network that contains major nodes for ‘image,’ ‘actor,’ ‘photograph,’ and ‘deepfake.’ Despite the term ‘deepfake’ still being used heavily in pornography, ‘deep learning’ seems niche enough that it is associated more with categorizations that we would use for such technology nowadays, like ‘artificial intelligence,’ ‘machine learning,’ and ‘data.’
In 2018, the ego-network is populated with even more technical terms. ‘Artificial intelligence’ has grown significantly, and ‘celebrity’ seems to have joined ‘actor’ in terms of size. It seems that in the growing presence of ‘celebrity’ and ‘actor,’ pornographic terms have also appeared. While it had not existed in the 2017 iteration, ‘pornhub’ is a significant node now.
For 2019, ‘celebrity’ surpasses ‘actor’ in terms of size, with more terms related to sexual content appearing. ‘deepfake pornography’ and ‘revenge porn’ join ‘pornhub’ as nodes. This is the year when face-related terms become prominent as well, like ‘face swap,’ ‘face,’ and ‘facial expression.’ Their rapid rise to prominence is impressive, since ‘face swap’ and ‘face’ are sizable nodes that are almost as big as ‘deep learning.’
2020 is an even more diverse set of nodes, with ‘deep learning’ fully eclipsed by the size of ‘artificial intelligence,' ‘deepfake,' and ‘image.' ‘celebrity' seems to have become the prominent node for an entertainment cluster involving a host of specific actor and movie names, like 'tom holland,' 'nicolas cage,' 'tom cruise,' 'the shining,' 'no country for old men,' 'star trek,' etc. This seems to imply a mainstream integration of deepfake technology where it is now so applicable to popular media, specific people and films can be categories.
In 2021 'deep learning' is surrounded by a host of other computer scientific terms, like 'artificial neural network,' 'generative adversarial networks,' 'autoencoder,' and 'unsupervised learning.' While it is comfortably larger than these other nodes, it is much smaller than the big three nodes which are 'deepfake,' 'image,' and 'artificial intelligence.'
Changes in the network can be further seen from the top 10 neighbouring nodes of 'deep learning' changing from 2017 to 2021. Highlighted in bold are the new web entities emerging around 'deep learning':

Figure 27. A comparison of top ten neighbors of ‘deep learning’ web entity in 2017 vs 2021.
'Deep learning' takes an intriguing evolutionary trajectory over the past five years, starting in a rather niche corner of the network (dominated by 'image' in 2017), and ending with a more varied family of other computer scientific web entities by 2021. It is of special interest to consider the rising popularity of certain categorizations over others, like how 'artificial intelligence' is only slightly larger than 'deep learning' in 2017 but quickly grows past it by the next year.
5.3.2. Sites of image ciculation: Google images and Google Vision's fully matching images
Our work resulted in two main themes. Our analysis was influenced by a sociological approach regarding de-platformization, clusterization and knowledge regarding the relation between enterprises and consumers.The two themes which correspond to chronological order can be described as the following: first, the evolution of the circulation of deepfakes, specifically from the disappearance of pornography to mainstream platforms; second, the emergence of Business, App and Tech actors, suggesting the open-access fabrication of deepfakes into the mainstream.
To understand how images relate to deepfake circulation, we used Google Vision’s fully matching images to construct a bipartite network of relations. The two node types were divided between websites and images, and the edges represented the presence of a certain image within a website. Using this method, we found clusters and groups of websites based on the similarity of content that was published in each part of the internet. As it was explained earlier, the dataset was divided in years from 2017 to June 2021. Our goal was to compare graphs of each period to understand the changes in the overall topology over time. The modularity class for each network was calculated to detect the presence of communities (if, in the visualization, two nodes belong to the same colour group, they have a stronger probability to be related than with those nodes that have different colors). Importantly, one aspect that should be noted is the strong fragmentation of the network. Considering the small network size having more than 100 clusters for each year, it comes to show how many different groups were considered relevant. Even though we made an effort to find constitutive clusters of the network, the algorithmic division of clusters was highly fragmented, meaning that in general the images don’t circulate as much as presumed, thus creating fewer connections through common images.
The topography of the network fluctuated a lot throughout 2017-2020, and the partial network of 2021. Because of this great change of topography throughout time, some main aspects must be considered. On a general note, the network’s complexity increases over time. While the first, in 2017 has two main clusters that can be described as a pornography cluster and the second, that is quite broad, divided between social media platforms, news and media, academia and many other topics that aren’t explicit. From 2019 on, the first cluster disappears, so our hypothesis is that the end of the division leaves space to many more subdivisions on the network which can be seen in the following years. Represented by the growth of interest in deepfakes by media coverage, discourse within social media platforms, the circulation and use of related stock image photos, academic research and lastly the creation of deepfake technology brought to the everyday user via apps and resources. To take a closer look at these topics, we took the most important website for each cluster - considering their centrality (in terms of eigenvector centrality) - and labelled in red its ego-network year after year. Concerning our interpretation, three main concepts must be discussed with special attention: de-platformization, clusterization and public-private relations.
First, deplatformization was attributed as a cause to the presence of pornography related content over time.

Figure 28. Main clusters of each network over time.
As mentioned, 2017 was characterized by a strong presence of pornography as the second biggest cluster (labelled in pink) of the year, covering around 7.87% of the network. As we can see in 2018, pornography was reduced to a much smaller cluster only a year after and gradually diminishes as months go by. When taking a closer look at all the other clusters during the year, it’s understandable that the difference can’t be attributed to a simple change on the websites themselves. In other words, pornography hasn’t stopped using deepfakes, but Google’s search and content moderation policies have changed over the years (Burgess, 2018). Here, the discussion of de-platformization (Rogers, 2020) is useful to understand the impact that search engine moderation can have.
However, when taking a look at the egonetwork of the two most important pornography websites of the network, we see quite a few different outcomes. The xvideos.com cluster has a strong impact. In total, 450 images were associated with the website. Even though xnxx.com, another pornography website, had a similar result, it is more interesting to compare the trajectory of xvideos.com with that of an actor serving as a bridging node between the pornography cluster and the more varied internet. Among the latter, the actor with the most impact is cloudgirl.com. This website, containing provocative but not necessarily explicit images, is not filtered by Google ranking mechanisms.
For a more in depth understanding, the ego-network of both sites were analyzed. The first image below represents in red all xvideos.com’s neighbours of neighbours, while the second one focuses on cloudgirl.com. In 2017, xvideos.com had a much higher presence on the network, connected to almost all the websites on the pornography cluster, in 2018, not only the cluster was drasticaly reduced, but from 2019 on, the website simply disappeared. By taking a closer look at the second network, it is possible to see that cloudgirl.com was actually able to be incorporated in the network even after 2019. One possible interpretation is that the deplatformization – or at least the difficulty imposed by Google to find explicit content – was responsible for a fragmentation from what is considered explicit or provocative.


Figure 29. Ego network of xvideos.com and cloudgirl.com (respectively) changing over time.
The sudden disappearance of explicit content on the platform can be seen as a warning on how the study of any platform is not a simple observation of actors behavior in an unmediated world. Quite the contrary, it asserts how the impact of the ‘environment’ can have an impact on the content itself. With that note in mind, it is possible to see how Google’s search tool can create clusters of content over time, and what they indicate on the current debate of deepfake, mediated by Google.
A second trend characterizing the evolution of the network over time is a progressive clusterization, mostly associated with an increasing specialization of functions. When taking a look at the 2017 network, it is possible to see two main clusters, pornography and ‘the mainstream’. However, the latter is not uniform and can have many different contents which are closely connected which marks a very specific development over time. Indeed it is possible to observe different niches of expertise following the trajectories of the four main actors: stock photography providers, academia, Amazon and app repositories.
Regarding the former, taking shutterstock.com as the main actor, we can see how the stock images market has increased and many others with the same principle appeared, even though Shutterstock was the first and most consistently impactful platform in that sense. As seen in the GIF below, Shutterstock has progressively built a more homogenous cluster. In 2017, the website was completely integrated inside the network, and had many connections. Likewise, from 2018 to 2019 the circulation led to a construction of its own cluster, with special emphasis on news & media coverage. This new clusterized part of the network had a downfall in 2020 where fewer websites have actually shared Shutterstock content on deepfakes. We can infer two main things based on the trajectory of its ego-networks.
The first is that the 2019 network was by far the most interested in Shutterstock images from many different topics, especially news and media content. However, with the decrease of circulation, many other actors appeared with the same proposal, with enough similarity to create a cluster more detached than in the previous year. It is important to stress that this doesn’t mean that the images were not used, but their dissemination was smaller throughout the network. It is possible to see how they ended up creating a cluster connected especially to social media and news media, highlighting their role in providing images to accompany articles and posts.

Figure 30. Construction of the shutterstock.com cluster over time.
The clusterization of Shutterstock is not an isolated example. We can see the same pattern with an academic cluster led by researchgate.com. It’s remarkable for its proximity to medium.com. In a similar fashion to Researchgate, Medium is responsible for much of scientific divulgation and commentary, the construction of a cluster more oriented to that sense shows how some images related to articles on deepfake were progressively shared between academia in general.
As the interest in deepfakes spreads, the general public becomes more interested in the technology. By that aspect, the evolution of Amazon over time is also pretty interesting to look into: this small, influential actor between 2019 and 2020 was very much connected to social media (especially YouTube and Blogspot) but by 2021 consists of a proper cluster, connected not only to social media, but also to stock photography cluster. As most deepfake require a great amount of data to be constructed, not always locally run programs can do so. Amazon’s cloud computing can be advertised as the technology capable of dealing with this specific criteria. The separation from the others in a cluster can indicate how it has professionalized with its own content regarding the matter. In addition to this professionalization, since 2020 App repositories whose evolution is well represented by Apkpure, come to recede from the network building their own cluster. This suggests a specialization in providing technology for the production of deepfakes, even for entertainment purposes or consumers with no technical skills.


Figure 31. Construction of Amazon and Apkpure clusters over time (respectively).
The variety of clusters that started to appear after the disapearance of pornography are very likely to be a signal of the popularity of deepfakes in public discussion. The many different approaches that can be seen from academia, technology, stock images to create and publicize deepfakes, and others, must be understood as a more varied way of consuming the technology. As the subject went from early adopters to become a topic in news and media discussion, business and the general public were also interested in it.
Finally, to compare each network and see the impact of its main actors, we focused on observing how the centrality of each site (relevance weighted by node neighbors) would change over time. The graph shows the changes in centrality from 2017 until 2021, and it is filtered only with sites that have more than 25% centrality for each year. That means that if a site doesn’t appear anymore it has either left the network, or it has receded its centrality.

Figure 32. Eigenvector Centrality of the main sites during the years.
There are a few aspects that must be considered. First, the major change that happens from 2017 to 2018, is that initially pornography sites such as xvideos.com and xnxx.com had a substantial centrality score. However, they disappear from 2018 onwards. On the other hand, Pinterest, which was the main website for deepfake search with 100% centrality, progressively declined its rates around 40% in two years. Overall, from 2018 until 2020, YouTube provided the results to most of the images that circulated over the topic of deepfakes, perhaps because many content producers discussed deepfake technology in their videos and, in doing so, retrieved existing images and incorporated them in online videos, mostly as thumbnails. However, an uprising of new players was introduced in the following years:
-
Shutterstock, that has become the third most important site in 2021;
-
brainstudy.info (whose domain name has expired), that has grown from 2019 to 2020;
-
The Verge or Medium, whose growth in 2021 suggests an increasing attention of the media and public opinion.
The plot shows that for a while YouTube had most of the image circulation going through its platform, however, with time, even though it was still the most influential actor, its distance to others has weakened.
5.3.3. Geographical mapping: Twitter hashtags and Google Vision web entities
Our key findings are listed below:
-
From 2018 to 2021, deepfakes related content has traveled and spread around the world since it has risen in the United States;
-
There is evidence of the employment of specific vernaculars in specific countries to describe image content related to deepfakes;
-
The development of a methodological path to analyze images' content without the need to render the images by using Twitter hashtags and Google Vision API web entity classification.
The coordinate based overview indicates that images are tweeted from many places around the world, but with the greatest density in the U.S., Europe and South America:

Figure 33. Coordinate map showing tweet density based on geolocation data.
Note that the results above are approximations in multiple ways: the coordinates are incomplete (Number of entries: 459; no coordinates found for: 72), invalid (due to mistaken query results), and imprecise (locations often consisted only of city or country name).
The choropleth maps visualizing the changing density of tweets over time based on the country codes provided in the dataset show how the locations, from which images were allegedly tweeted, changed over time:

Figure 34. Choropleth map showing tweet density based on geolocation data overtime.
Taking the lack of data for the year 2021 into account, the sequence of visualisations shows how the tweets containing images in our dataset do indeed travel across the world: starting from the U.S., Canada and GB (incidentally, all at least partially native English language countries), tweets are consecutively also posted from other parts of Europe, South America, and Asia/Australasia. It should be noted that most of these places feature only a small number of tweets, in contrast to the majority posted from North America and Europe.
Twitter hashtags - images network analysis
We conducted a Twitter hashtag-image network analysis to understand how images and hashtags correlate and are attached to specific countries. Thereby, nodes that represent hashtags were colored white. Nodes that represent the images were rendered as the respective .jpg file (using the ImagePreview Gephi Plugin), and were colored by the Twitter API country-code as the respective edges (see color legend).

Figure 35. Twitter hashtags - images bipartite network (created using Gephi's Force Atlas 2 layout).
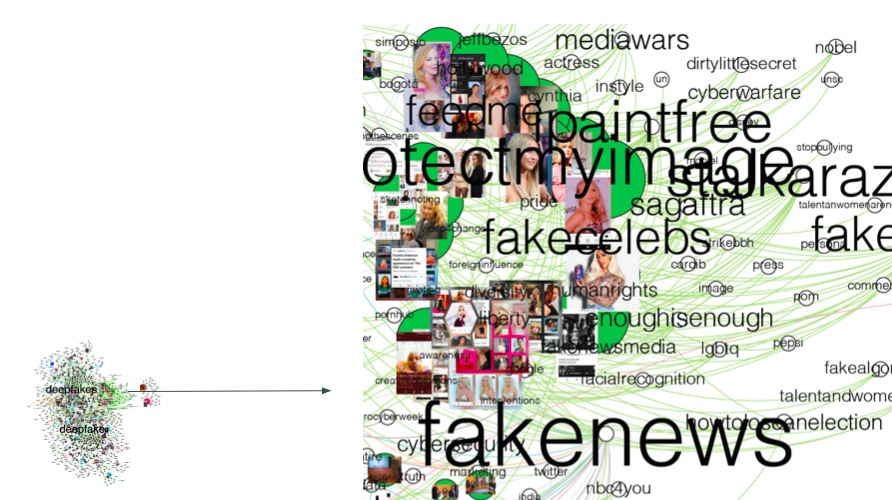
Figure 36. Zoom of the Twitter hashtags - images network (green nodes represent images shared on Twitter in the US).
We zoomed into the US as it is the country with the most locational data and the country where dominant discourses appear. Albeit, there are some images that refer to conferences, the more dominant trend is commercialisation, consumerism and individualisation of discourse of deepfakes. The discourse can be understood within the trope of pop culture and celebrities. We could find celebrities such as Jeff Bezos, Jack Nickolson, Kylie Minogue, Kim Kardashian; political figures as Boris Johnson and Trump; as well as brands (Pepsi, Amazon, Amazon Prime, InStyle).
We furthermore used image sorting of US images to see if the discourse surrounding deepfakes in the US also shows here. Similar trends and the major trope of popular culture represented by celebrities and consumerism are visible.

Figure 37. Image sorting analysis of US discourse around deepfakes on Twitter.
Google Vision API web entities - country network analysis
To visualize the existence of country based vernaculars related to the deepfake debate on Twitter, a cross-platform analysis approach was chosen. We have generated a bipartite network to relate the web entity Google Vision API to describe an image by the country code returned by Twitter's API to locate the same image. We have found specific clusters of web entities for different countries.
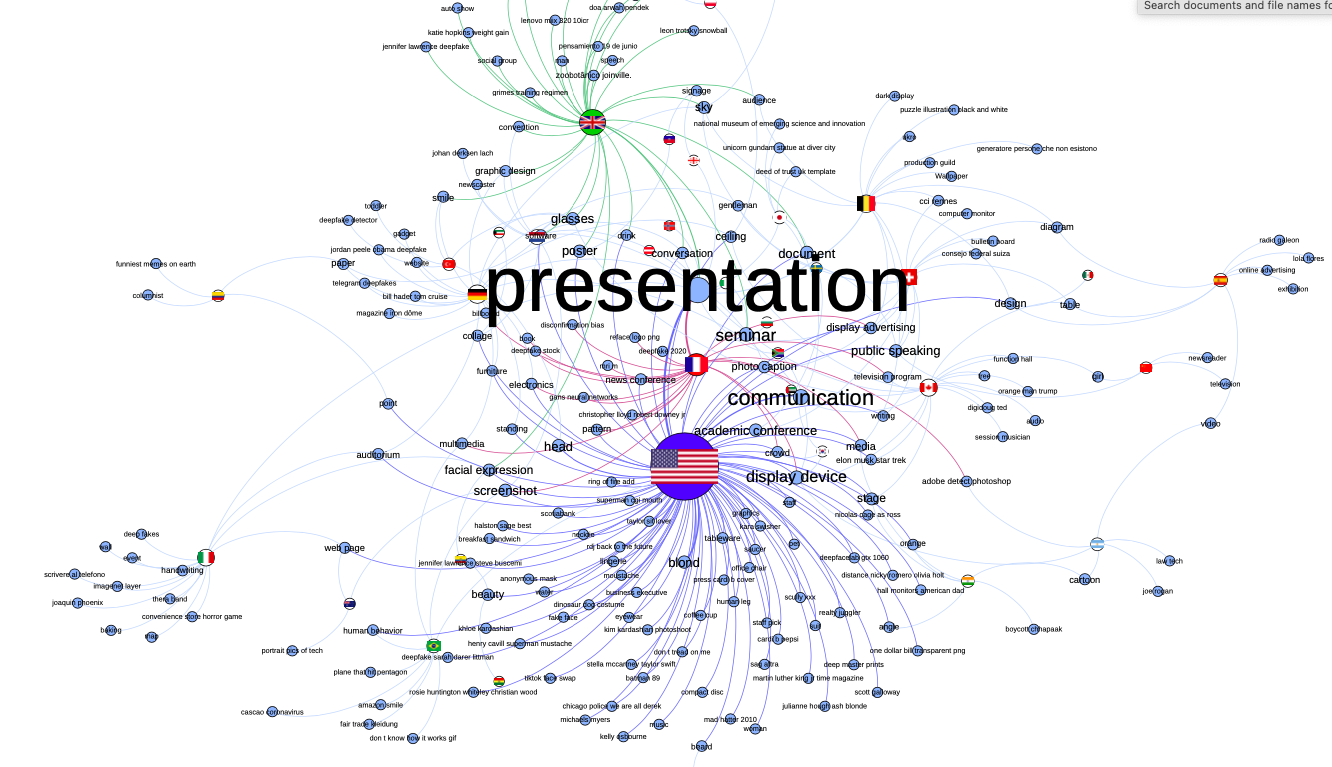
Figure 38. Web entities - country bipartite network (created using Gephi's Force Atlas 2 layout).
In Figure 38, nodes that represent web entities were colored 'light blue' and country flags images were rendered as the respective country node. Images are represented by the edges. All nodes are sized by occurrence number and the labels were scaled proportionally. In addition, we have colored nodes and edges of the three most frequent countries in our data: United States (168 images, color = royal blue), Great Britain (45 images, color = green), and France (32 images, color = red).

Figure 39. United States zoom of the web entities - countries bipartite network.
Methodological path to read images without rendering files
Considering the limitation of working with a small dataset of geolocated images, we employed the strategy of crossing data collected from different sources. Thus, we have compiled a table containing information on how Twitter users tagged images (hashtags) and from how Google Vision API describes the images (web entity).

Figure 40. Google Vision web entities - Twitter hashtags bipartite network (created using Gephi's Force Atlas 2 layout). Twitter nodes are colored blue and Google Vision's, pink, while the edges represent the images.
Our analysis indicates that the discourse about deepfakes has a similar structure in computer vision API images' description and in users' choice of hashtags. In this way and based on the existence of specific vernaculars for images shared on Twitter in specific countries, we have noticed that it is possible to adopt this methodological strategy when trying to understand a (very large) set of images that are geographically located. In other words, our findings indicate that computer vision APIs can be used to describe a set and extract relational structures and common topics of these images without having to render and visualize them. Web entities give meaning to images while hashtags provide context to the pictures (Google Vision API did not return any web entity result relating the images to deepfake).

Figure 41. Methodological strategy developed to use network analysis in the description of geolocated images utilizing user description data (hashtag) and computer vision API data (web entity classification).
Focussing on the geographic and geopolitical characteristics and temporal shifts of the Twitter data related to the images marked with #deepfakes or #deepfake, we were able to
-
show how the location of image tweets gradually spreads across the world;
-
expose particular, country-based and thus vernacular sets of topics covered by the images;
-
find that GV API web entities allow for identifying such vernacular and common sets of topics communicated via images.
Taken together, our approach is able to expose location-based - and potentially cultural and/or language based - differences and commonalities in the discourses surrounding deepfakes, and reveals respective temporal changes.
Our findings should be interpreted with caution, considering that the data are biased towards particular language spaces (potentially related to the search terms #deepfakes and #deepfake), and may not represent accurate locations. Nonetheless, the analysis indicates that the related discourse on Twitter cannot be regarded as one homogeneous phenomenon. It remains to be seen whether such suspicion can be validated with larger datasets.
6. Discussion and conclusions
The purpose of the present project is to understand the phenomenon of fake content by looking at the discourses around the issue of deepfakes, how they evolve over time, and what are the actors and interests related to such an issue. In this section, we aim at summing up the main findings, and we argue that the discourses and representations about deepfake technologies, as well as the network of actors surrounding them, contribute to the ongoing and ever-changing construction of deepfakes as a matter of concern.
The results show how deepfake technologies are discussed from different perspectives and by different actors, and how these representations change from 2017 to June 2021. In the first years (2017-2018), the debate is mostly related to pornographic content and deepfake pornography. Subsequently, starting from 2019, moral panic and dystopian views of deepfakes emerge, with a specific emphasis on fake news and information disorder in the Twitter sphere. To balance such a perspective, in the following years discourses about detection and regulation, oriented by a techno-solutionist approach, start to get more and more space. These are also the years when commercial content and the depiction of deepfakes as a lucrative industry start to appear, together with concerns regarding “the future of deepfakes”.
It is important to notice that there are relevant similarities between the textual discourses, backed up by the resources we found in the url analysis, and the visual ones. Beside this alignment, visual analysis and web entities analysis provide us with additional and complementary information about the issue of deepfakes - thus highlighting the importance of blending different methodological approaches to fully understand the object of study. In particular, the visual analysis centered on colour patterns (Imagesorter) and similarity (Pixplot) provides insights about the main themes and individuals represented in the dataset. More specifically, the data show the emergence of art, culture and entertainment, beside politics and information. Similar insights emerge from the visual entity analysis, with the relevance of the clusters ‘art’, ‘celebrity’ and ‘politics’. It is worth noting that these results point to the mainstream integration of deepfake technology, which becomes increasingly applicable to traditional media, popular culture and entertainment.
Such a process of mainstreaming can be seen in the image circulation analysis as well. As deepfakes move to early adopters to be covered in the news and media, the general public as well as different kinds of businesses become interested in the issue. Indeed, the variety of clusters and themes that started to appear after the disapearance of pornography are very likely to be a signal of the popularity of deepfakes in the public discussion. The many different approaches that can be seen from academia, technology, and stock images to create and publicize deepfakes can be understood as a varied way of discussing and consuming this technology.
As seen so far, the various discourses around deepfakes do not only evolve over time; rather, they coexist and compete for a spotlight in the public debate (what we referred to as ‘competitive narrative’, Section 5.1.2). Such forms of co-existence and competition can also be found in the analysis of images and their sites of circulation, where an increasing specialization and clusterization of themes, as well as actors, emerges over time (see Section 5.3.2.). In general, images were not circulating as much on diverse online spaces as expected.
Another purpose of our work is to map out the key actors, industries and interests revolving around deepfakes. From the discourse analysis on Twitter, we saw that different actors are associated with different sentiments about deepfakes. In particular, governmental, mainstream media, and politicians accounts tend to have a more negative, warning, and dystopian attitude, whereas academic and specialized media profiles tend to have a more neutral and informative attitude. Furthermore, it is interesting to observe how the issue of deepfakes has in time been used as a way of getting attention and constructing a branded self, all practices adopted by what we called spam users and spam content (see Section 5.1.4 and 5.2.1). As the data show, such behaviours can also have contributed to increasing the hype around deepfakes in a dystopian way.
Moreover, by looking at the image circulation analysis, it is possible to observe four main actors, each with specific interests and expertise: stock photography providers (e.g. Shutterstock), academia (e.g. Researchgate and Medium), Amazon and app repositories allowing the everyday user to create deepfake for entertainment purposes.
Since 2017, the emerging infrastructure around deepfake has changed with new industries joining the game. Whereas some platform businesses such as Pinterest lose impact, others such as Amazon seem to have an increasing impact. For Amazon, instead of sharing images mainly with other social media platforms (Youtube and Blogpost), there is an increasing amount of stock photography market relations that hint to an ongoing professionalization of Amazon as a potential cloud service provider that is used to produce deepfakes (see Section 5.3.2.). Further, the rise of Medium and The Verge in 2021 highlights the emerging public interest, whereas Medium serves to share scientific commentary and thereby enters the academic discourse.
In light of these findings, we can argue that deepfakes are constructed and staged as matters of concern through different discourses and by different actors. Firstly, such a construction emerges in the discussion about deepfakes in terms of dystopian vs techno-solutionists points of view. In a sort of competition for attention in the public discourse, the hype around deepfakes is alternatively ignited and switched off, and the risks related to deepfakes in terms of misinformation and disinformation inscribed within these two competing and co-existing approaches. AI technologies, softwares and apps play a pivotal role in such a construction of deepfakes as an issue, and specifically in the practices of creating vs detecting deepfake content. The presence and the emergence of these technologies in a way falls again in the dystopian vs techno-solutionist dichotomy and points to the presence of a lucrative industry which leverages on deepfakes as a danger for our society and democracy. Furthermore, deepfakes are related to a ‘technification’ and ‘anti-technification’ of certain concepts. In particular, by looking at the web entity analysis, the issue of ‘security’ shifts from software and hardware related concerns over to more embodied and personal aspects. On the contrary, the notion of ‘face’ is used in increasingly technical terms along the lines of deepfake technology instead of something related to individual persons – despite the observed trend that deepfakes become more and more associated with images of people. At the same time, the shift from explicit pornographic imagery over to a futuristic aesthetic shows that technification also occurs on the level of style. This explains why people are increasingly displayed, but highly intimate or even abusive imagery that hints to the actual origin and still ongoing use of deepfakes to harass private individuals has been substituted by images that depict people who are ‘far away’ (celebrities, technified humans) and emphasize potential future realities that are distant from current reality.
The dystopian vs techno-solutionist ways of conceiving and constructing deepfakes as a matter of concern coexist with the progressive mainstreaming of these kinds of technology, from techno-enthusiasts and the niche of pornography to the broader public. And indeed, besides the dangers related to deepfakes, this technology is often time inscribed within the entertainment domain, and defined in terms of pranks, comedy and even art.
Lastly, it is important to stress that despite the co-existence of different discourses, pornographic content and deepfake pornography slowly disappears both from visual and textual discourses. This is partly due to processes of content moderation, as in 2018, many platforms such as Reddit and Pornhub, as well as Twitter and Google, took action to remove non consensual pornogpraphy created with the aid of AI softwares and applications (Burgess, 2018). Significantly, therefore, the progressive shrinking of pornographic content and the moderation of deepfake pornography occur simultaneously. Furthermore, from the image circulation analysis, it emerges that although pornography disappear from 2018 onwards, provocative content has been integrated into the mainstream. Pornographic content therefore disappears and, as a consequence, pornography doesn’t seem to represent a matter of concern in relation to deepfakes. However, increasing research stresses how deepfake pornography is still an issue and is actually rising (Deeptrace, 2019). Therefore, the emphasis on deepfakes promoting political disinformation and misinformation may hide the harm they are currently causing in terms of image-based sexual abuse and non consensual dissemination of intimate images.
The complexity of our research, which relies on a variety of methods and visual analytics, leads to some necessary methodological considerations. We adopted different approaches to analyse deepfakes: from grasping the broader picture with discourse analysis, to the bird-eye view of visual content with image grouping and the creation of meta-pictures, to then the more granular insights provided by the web entities analysis, which, although with some possible limitations (see below), allows for an understanding of the different elements constituting the images and their circulation. These different approaches are complementary, and overall give us the possibility of understanding deepfakes from different perspectives. Beside this complementarity, we found that some methods are more suitable than others to grasp certain aspects of the object of study. This emerges clearly in accounting for the country-specific discourses around deepfakes and the different vernaculars for different geographical locations, which are more easily detectable with the use of computer vision techniques (and specifically by means of web entities analysis), whereas there are no significative differences if using a visual attributes analysis with Imagesorter. Another important methodological consideration is to read images without rendering the files. Using computer vision retrieved image information (e.g. web entities or URLs of fully matching images) in combination with other image-related meta-data (e.g. Twitter hashtags or geolocation) one retrieves ‘enriched’ images which are now interpretable by web-related – instead of visual – information. Despite the vagueness of semantic evaluation through computer vision techniques, this added semantic layer showed promising potential as a methodology: In our project it led to interesting insights by generating stories around images as they travel across web pages or latch onto geographically-based tweets (Computer Vision, see Section 5.3). One might consider this method in particular for exploratory research as it can create alternative insights and stories as a stepping stone to further analysis.
Lastly, we would like to highlight some limitations and possible paths for future research.. The project is based on two types of data, Google data and Twitter data. Although one of the sub-projects was specifically aimed at looking at image patterns and vernaculars by comparing the two platforms (Image vernaculars and trends, see Section 5.2), the results didn’t show specific platform vernaculars in the representations of deepfakes. Such an insight highlights a homogeneity in the discourses we analysed. However, there is room for further developing a cross-platform analysis by adding other platforms to the picture (e.g. Instagram, YouTube, among others). Such an analysis would allow us to have more insights about whether the discourses and representations of deepfake technology differ across platforms. Moreover, it is important to take into account the limitations related to the use of computer vision and, specifically, Google Vision API. A possible path for future research would be to perform a cross-vision API analysis, to test the potential of different APIs and account for the similarities and/or differences emerging from the data analysis.7. References
Abernathy, D. (2017). Using Geodata and Geolocation in the Social Sciences: Mapping our Connected World. https://doi.org/10.4135/9781473983267.
Alvarez-Socorro, A. J., Herrera-Almarza, G. C., & González-Díaz, L. A. (2015). Eigencentrality based on dissimilarity measures reveals central nodes in complex networks. Scientific reports, 5(1), 1-10.
Ash, J., Kitchin, R., & Leszczynski, A. (2018). Digital turn, digital geographies? Progress in Human Geography, 42(1), 25–43. https://doi.org/10.1177/0309132516664800.
Brandon, R. (2019). Deepfake propaganda is not a real problem. The Verge. https://www.theverge.com/2019/3/5/18251736/deepfake-propaganda-misinformation-troll-video-hoax.
Burgess, M. (2018). The fightback against AI-generated fake pornography has begun. Wired. https://www.wired.co.uk/article/deepfakes-banned-reddit-ai-creates-fake-porn-gyfcat.
Campolo, A., & Crawford, K. (2020). Enchanted determinism: Power without responsibility in artificial intelligence. Engaging Science, Technology, and Society, 6, 1-19.
Chao, T. H. J. (2021). Memespector GUI: Graphical User Interface Client for Computer Vision APIs (Version 0.2) [Software]. Available from https://github.com/jason-chao/memespector-gui.
Chesney, R., & Citron, D. (2019). Deepfakes and the new disinformation war: The coming age of post-truth geopolitics. Foreign Aff., 98, 147.
De Vries, K. (2020). You never fake alone. Creative AI in action. Information, Communication & Society, 23(14), 2110-2127.
D’Ignazio, C., & Klein, L. F. (2020). Data Feminism. MIT Press.
Deeptrace (2019). The state of deepfakes. Landscape, threats, and impact. Available at: https://regmedia.co.uk/2019/10/08/deepfake_report.pdf.
De Vries, K. (2020). You never fake alone. Creative AI in action. Information, Communication & Society, 23(14), 2110-2127.
Google. (n.d.). Information Quality Content Moderation White Paper. Google Blog. Retrieved July 29, 2021, available at: https://blog.google/documents/83/information_quality_content_moderation_white_paper.pdf/.
Graham, M., Hale, S. A., & Gaffney, D. (2013). Where in the World are You? Geolocation and Language Identification in Twitter (SSRN Scholarly Paper ID 2224233). Social Science Research Network. https://papers.ssrn.com/abstract=2224233.
Haraway, D. (1988). Situated Knowledges: The Science Question in Feminism and the Privilege of Partial Perspective. Feminist Studies, 14(3), 575. https://doi.org/10.2307/3178066.
Lorenz, P., & Saslow, K. (2019). Demystifying AI and AI Companies–What Foreign Policy Makers Need to Know About the Global AI Industry. Available at SSRN 3589393.
Maddocks, S. (2020). ‘A Deepfake Porn Plot Intended to Silence Me’: Exploring continuities between pornographic and ‘political’ deep fakes. Porn Studies, 0(0), 1–9. https://doi.org/10.1080/23268743.2020.1757499.
Mikael. (2017, March 26). Scraping, extracting and mapping geodata from Twitter. Mikael Brunila. http://www.mikaelbrunila.fi/2017/03/27/scraping-extracting-mapping-geodata-twitter/.
Mitchell, W. J. T., & Hansen, M. B. (Eds.). (2010). Critical terms for media studies. University of Chicago Press.
Nagel, E. van der. (2020). Verifying images: Deepfakes, control, and consent. Porn Studies, 0(0), 1–6. https://doi.org/10.1080/23268743.2020.1741434.
Omena,J.J., Pilipets, E., Gobbo, B.& Chao, J.(forthcoming). The potentials of Google Vision API-based networks to study natively digital images. Diseña.
Paris, B., & Donovan, J. (2019, September 18). Deepfakes and Cheap Fakes. Data & Society; Data & Society Research Institute. https://datasociety.net/library/deepfakes-and-cheap-fakes/.
Rogers, R. (2020). Deplatforming: Following extreme Internet celebrities to Telegram and alternative social media. European Journal of Communication 35(3), 213-229. https://doi.org/10.1177/0267323120922066.
Rogers, R. (2021). Visual media analysis for Instagram and other online platforms. Big Data & Society. https://doi.org/10.1177/20539517211022370.
Schlosser, S., Toninelli, D., & Cameletti, M. (2021). Comparing Methods to Collect and Geolocate Tweets in Great Britain. Journal of Open Innovation: Technology, Market, and Complexity, 7(1), 44. https://doi.org/10.3390/joitmc7010044.
Vaccari, C., & Chadwick, A. (2020). Deepfakes and Disinformation: Exploring the Impact of Synthetic Political Video on Deception, Uncertainty, and Trust in News. Social Media + Society, 6(1), 39-52. https://doi.org/10.1177/2056305120903408.
Westerlund, M. (2019). The Emergence of Deepfake Technology: A Review. Technology Innovation Management Review, 9(11). https://timreview.ca/article/1282.
Zhao, B., Zhang, S., Xu, C., Sun, Y., & Deng, C. (2021). Deep fake geography? When geospatial data encounter Artificial Intelligence. Cartography and Geographic Information Science, 48(4), 338–352. https://doi.org/10.1080/15230406.2021.1910075.


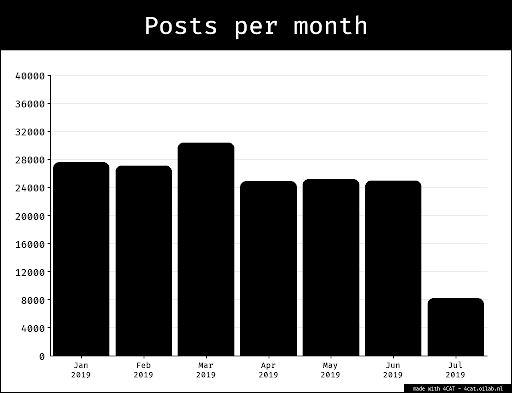
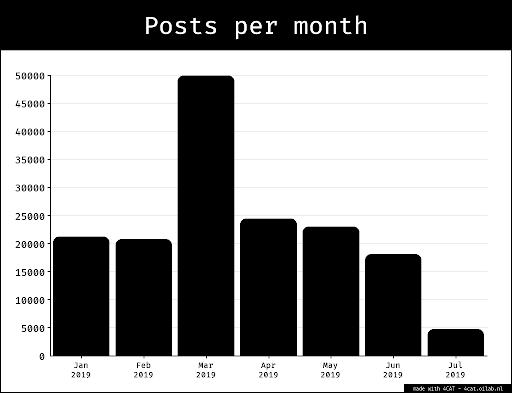
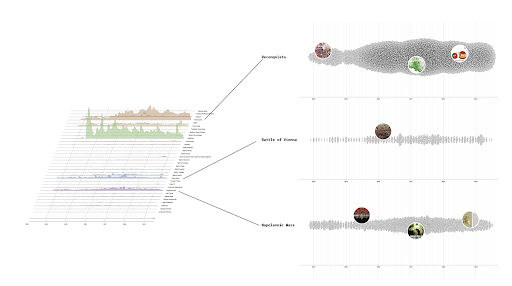
Ideas, requests, problems regarding Foswiki? Send feedback