You are here: Foswiki>Dmi Web>WinterSchool2024SyntheticImages (22 Mar 2024, DenisTeyssou)Edit Attach
-- DenisTeyssou - 20 Feb 2024
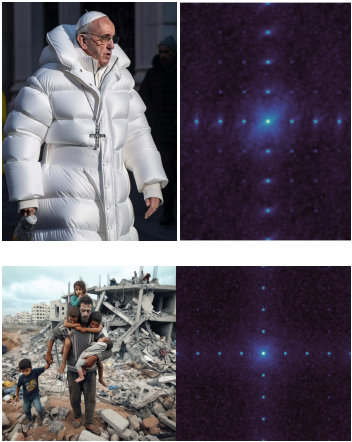
 Figure 1 : on the left, two of the studied synthetic images. On the right, their corresponding spectral traces, obtained following the Synthbuster method [1] by applying a high-pass filter to the image and looking at their Fourier transform. Bright regions on the right images correspond to a specific frequency that contains more information than the rest of the image. As can be seen, synthetic images show distinctive peaks in this visualization.
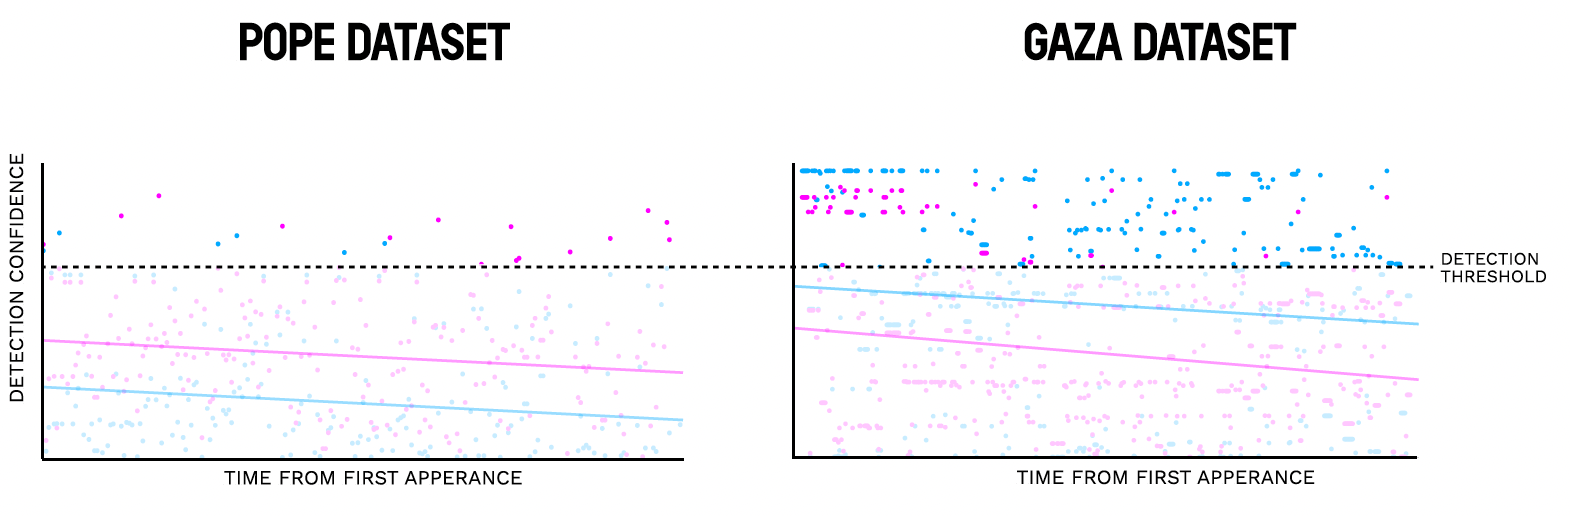
 On the left, the scattered plot presents all the detection results performed by our tool methods on more than 600 versions of the Pope generated hyperrealistic image. The dotted black horizontal line represents the empirical threshold for detection, set at 70% to avoid false positives. Despite promising results, most of the degraded copies cannot be detected.
On the right, we can also observe on the chart that we detect more copies than on the chart of the left. Our analysis shows that the first indexed image was immediately slightly resampled before its second publication. Such a degradation strongly affects detectability. This degraded image was the one that was massively shared and further degraded, much more so than the originally-generated image, explaining the much lower results. Still, on both charts, the downward sloping trend lines are a sign that detecting the copies of the images is increasingly harder when the copies are further apart in time.
On the left, the scattered plot presents all the detection results performed by our tool methods on more than 600 versions of the Pope generated hyperrealistic image. The dotted black horizontal line represents the empirical threshold for detection, set at 70% to avoid false positives. Despite promising results, most of the degraded copies cannot be detected.
On the right, we can also observe on the chart that we detect more copies than on the chart of the left. Our analysis shows that the first indexed image was immediately slightly resampled before its second publication. Such a degradation strongly affects detectability. This degraded image was the one that was massively shared and further degraded, much more so than the originally-generated image, explaining the much lower results. Still, on both charts, the downward sloping trend lines are a sign that detecting the copies of the images is increasingly harder when the copies are further apart in time.
 The left chart shows the detection results of our two CNN-based methods LDM [3] and ADM [4] per indexation time (on the charts, new version of the LDM model in blue and paper version of LDM in Green, ADM model in pink). We observe a decrease of detection over time which confirms our preliminary hypothesis. Images posted on social networks are often degraded copies of the previously circulating images. The pope images in our dataset mostly came from Twitter posts and mentions. This image from March 2023 has marked the rise of viral generative images on social networks. Our dataset focuses on the first images indexed by search engines to try to capture the first occurrences of the generated image.
In the right chart, the LDM (Latent Diffusion Model) in blue performs better than the ADM (Adaptive Diffusion Model) in pink. This result shows the complementarity of the two methods as ADM sometimes yields better results, as displayed on the left chart. We used a moving average to smooth the detection confidence curves in both charts, so as to better identify the downward trend over time.
Link to the final poster: Synthetic Image Detection lowres.pdf
The left chart shows the detection results of our two CNN-based methods LDM [3] and ADM [4] per indexation time (on the charts, new version of the LDM model in blue and paper version of LDM in Green, ADM model in pink). We observe a decrease of detection over time which confirms our preliminary hypothesis. Images posted on social networks are often degraded copies of the previously circulating images. The pope images in our dataset mostly came from Twitter posts and mentions. This image from March 2023 has marked the rise of viral generative images on social networks. Our dataset focuses on the first images indexed by search engines to try to capture the first occurrences of the generated image.
In the right chart, the LDM (Latent Diffusion Model) in blue performs better than the ADM (Adaptive Diffusion Model) in pink. This result shows the complementarity of the two methods as ADM sometimes yields better results, as displayed on the left chart. We used a moving average to smooth the detection confidence curves in both charts, so as to better identify the downward trend over time.
Link to the final poster: Synthetic Image Detection lowres.pdf
Detecting synthetic images
Main takeaways
Our goal was to explore the disparity of results of the vera.ai project synthetic image detection feature and to study what are the limitations to such detection. The exploration of five datasets containing real-world copies of synthetically-generated images shared on social media platforms (one on the Pope in white coat and four Gaza-war related images) confirmed our initial hypothesis that the detection rate decreases over time. It also showed the complementarity of our current methods. More surprisingly, we found that image compression is not as much of an issue as expected, both when extracted from the metadata and analyzed on the image [2]. Remaining issues for further research include exploring image resampling as well as the image's compression history to study how redimensioning and mutiple compressions affect the detectability of AI-generated images.How does detection work?
Image generators are leaving invisible spectral artifacts in the image signal frequencies as shown by the bright spots present in Figure 1, obtained using the Synthbuster method [1] developed by Quentin Bammey. Nevertheless, those traces may disappear if the image quality is degraded while spreading on different websites and social networks. The GRIP-UNINA methods [3, 4] are detecting the traces through a Convolutional Neural Network (CNN) classifier trained to distinguish real and fake images using their spatial traces. It returns a score predicting if the image was generated by AI-models.
Figure 1 : on the left, two of the studied synthetic images. On the right, their corresponding spectral traces, obtained following the Synthbuster method [1] by applying a high-pass filter to the image and looking at their Fourier transform. Bright regions on the right images correspond to a specific frequency that contains more information than the rest of the image. As can be seen, synthetic images show distinctive peaks in this visualization.
Data collection
We focused on a few viral AI-generated images already debunked by fact-checkers, first by using a keyword search on Google Fact Check Explorer. Then, we queried a new beta tool also from Google Fact Check Explorer, Image Context, to see through similarity search, the context and the timeline of each image. We then collected 1000 different links per image coming mostly from social media posts. We then automated the retrieval of the image urls and manually verified the image quality, filtering out screenshots of X/Twitter posts, cropped images, memes, image collages, and edited and therefore already altered images.Data analysis
On the left, the scattered plot presents all the detection results performed by our tool methods on more than 600 versions of the Pope generated hyperrealistic image. The dotted black horizontal line represents the empirical threshold for detection, set at 70% to avoid false positives. Despite promising results, most of the degraded copies cannot be detected.
On the right, we can also observe on the chart that we detect more copies than on the chart of the left. Our analysis shows that the first indexed image was immediately slightly resampled before its second publication. Such a degradation strongly affects detectability. This degraded image was the one that was massively shared and further degraded, much more so than the originally-generated image, explaining the much lower results. Still, on both charts, the downward sloping trend lines are a sign that detecting the copies of the images is increasingly harder when the copies are further apart in time.
The left chart shows the detection results of our two CNN-based methods LDM [3] and ADM [4] per indexation time (on the charts, new version of the LDM model in blue and paper version of LDM in Green, ADM model in pink). We observe a decrease of detection over time which confirms our preliminary hypothesis. Images posted on social networks are often degraded copies of the previously circulating images. The pope images in our dataset mostly came from Twitter posts and mentions. This image from March 2023 has marked the rise of viral generative images on social networks. Our dataset focuses on the first images indexed by search engines to try to capture the first occurrences of the generated image.
In the right chart, the LDM (Latent Diffusion Model) in blue performs better than the ADM (Adaptive Diffusion Model) in pink. This result shows the complementarity of the two methods as ADM sometimes yields better results, as displayed on the left chart. We used a moving average to smooth the detection confidence curves in both charts, so as to better identify the downward trend over time.
Link to the final poster: Synthetic Image Detection lowres.pdf
Participants:
| FACILITATORS | PARTICIPANTS |
| Denis Teyssou AFP Kamila Koronska UVA Richard Rogers UVA Luca Draisci DensityDesign |
Valentin Porcellini (AFP) Bertrand Goupil (AFP) Quentin Bammey (ENS) Dimitrios Karageorgiou (CERTH) Matus Solcany (UvA) Sara M. Hammerschmidt (UvA) Kwan Suppaiboonsuk (UvA) Franziska Tietze (Vienna univ.) Frieder Uhlig () Youri van der Weide (BellingCat) |
References:
[1] Bammey, Q. (2024). Synthbuster: Towards Detection of Diffusion Model Generated Images. In IEEE OJSP. [2] Bammey, Q. (2024). JPEG Compression Quality Analysis for Image Forensics and AI-Generated Content Detection. [3] Corvi, R., Cozzolino, D.,ingarini, G., Poggi, G., Nagano, K., & Verdoliva, L. (2023). On the detection of synthetic image generated by diffusion models. In IEEE ICASSP. [4] Cozzolino, D., Poggi, G., Corvi, R., Nießner, M., & Verdoliva, L. (2023). Raising the Bar of AI-generated Image Detection with CLIP. [5] Dogoulis, P., Kordopatis-Zilos, G., Kompatsiaris, I., & Papadopoulos, S. (2023). Improving Synthetically Generated Image Detection in Cross-Concept Settings. In Proceedings of the 2nd ACM International Workshop on Multimedia AI against Disinformation.

| I | Attachment | Action | Size | Date | Who | Comment |
|---|---|---|---|---|---|---|
| |
Amsterdam-charts.png | manage | 307 K | 21 Feb 2024 - 17:28 | DenisTeyssou | |
| |
Amsterdam-charts2.png | manage | 325 K | 21 Feb 2024 - 17:33 | DenisTeyssou | |
| |
Spectral-artefacts.png | manage | 305 K | 21 Feb 2024 - 17:15 | DenisTeyssou | |
| |
Synthetic Image Detection lowres.pdf | manage | 3 MB | 27 Feb 2024 - 15:53 | DenisTeyssou |
Edit | Attach | Print version | History: r7 < r6 < r5 < r4 | Backlinks | View wiki text | Edit wiki text | More topic actions
Topic revision: r7 - 22 Mar 2024, DenisTeyssou
Ideas, requests, problems regarding Foswiki? Send feedback